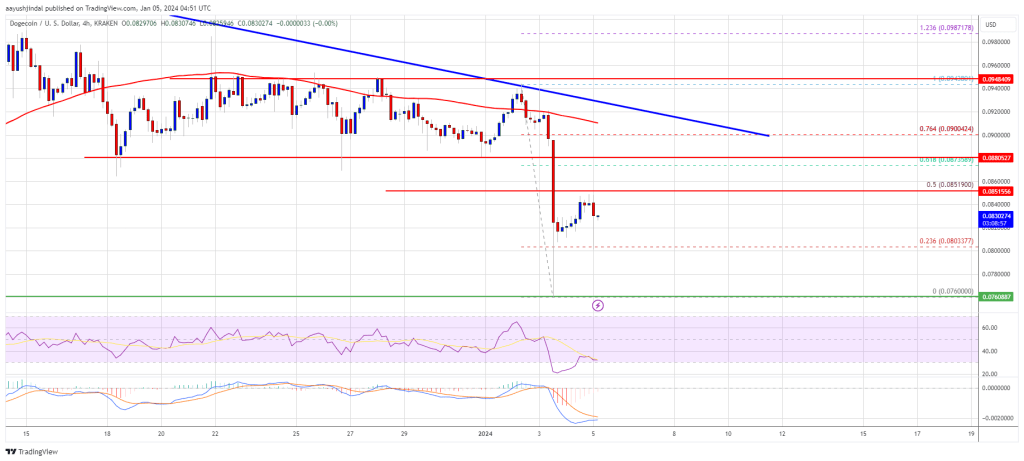
Dogecoin started a fresh decline from the $0.0950 resistance against the US Dollar. DOGE could extend its decline unless there is a close above $0.090.
Dogecoin은 미국 달러 대비 0.0950달러 저항에서 새로운 하락을 시작했습니다. DOGE는 종가가 $0.090를 넘지 않는 한 하락세를 연장할 수 있습니다.
- DOGE struggled near $0.0950 and started a fresh decline against the US dollar.
- The price is trading below the $0.090 level and the 100 simple moving average (4 hours).
- There is a key bearish trend line forming with resistance near $0.0920 on the 4-hour chart of the DOGE/USD pair (data source from Kraken).
- The price could start a recovery wave if it clears $0.090 and $0.0950.
DOGE는 $0.0950 근처에서 어려움을 겪었고 미국 달러 대비 새로운 하락세를 시작했습니다.
가격은 $0.090 수준과 100 단순 이동 평균(4시간) 아래에서 거래되고 있습니다.
DOGE/USD 쌍의 4시간 차트에는 $0.0920 근처의 저항과 함께 주요 약세 추세선이 형성되어 있습니다(Kraken의 데이터 소스).
$0.090와 $0.0950가 청산되면 가격은 회복세를 보일 수 있습니다.
Dogecoin Price Faces Key Hurdles
Dogecoin 가격은 주요 장애물에 직면
In the past few sessions, Dogecoin price struggled to gain pace above $0.0920. DOGE remained below the $0.095 resistance zone and started a fresh decline, like Bitcoin and Ethereum.
지난 몇 번의 세션에서 Dogecoin 가격은 $0.0920 이상으로 상승하는 데 어려움을 겪었습니다. DOGE는 $0.095 저항대 아래에 머물면서 비트코인과 이더리움처럼 새로운 하락세를 시작했습니다.
There was a sharp drop below the $0.0900 and $0.0865 support levels. It even tested the $0.0760 zone. A low was formed near $0.0760, and the price is now attempting a recovery wave. There was a move above the $0.080 resistance zone.
$0.0900 및 $0.0865 지원 수준 아래로 급격한 하락이 있었습니다. 심지어 $0.0760 영역도 테스트했습니다. 0.0760달러 부근에서 최저치가 형성되었으며 현재 가격은 회복세를 보이고 있습니다. $0.080 저항대를 넘어서는 움직임이 있었습니다.
It cleared the 23.6% Fib retracement level of the downward move from the $0.0943 swing high to the $0.0760 low. DOGE is now trading below the $0.090 level and the 100 simple moving average (4 hours). There is also a key bearish trend line forming with resistance near $0.0920 on the 4-hour chart of the DOGE/USD pair.
$0.0943 스윙 고점에서 $0.0760 저점까지 하락 움직임의 23.6% Fib 되돌림 수준을 제거했습니다. DOGE는 현재 $0.090 수준과 100 단순 이동 평균(4시간) 아래에서 거래되고 있습니다. DOGE/USD 쌍의 4시간 차트에는 $0.0920 근처의 저항과 함께 형성되는 주요 약세 추세선도 있습니다.
On the upside, the price is facing resistance near the $0.0875 level. It is close to the 61.8% Fib retracement level of the downward move from the $0.0943 swing high to the $0.0760 low. The next major resistance is near the $0.090 level.
반면 가격은 0.0875달러 근처에서 저항을 받고 있습니다. $0.0943 스윙 고점에서 $0.0760 저점까지 하향 이동하는 61.8% Fib 되돌림 수준에 가깝습니다. 다음 주요 저항은 $0.090 수준에 가깝습니다.
Source: DOGEUSD on TradingView.com
출처: TradingView.com의 DOGEUSD
A close above the $0.090 resistance might send the price toward the $0.092 resistance. The next major resistance is near $0.095. Any more gains might send the price toward the $0.105 level.
$0.090 저항선 위로 종가가 형성되면 가격이 $0.092 저항선 쪽으로 향할 수 있습니다. 다음 주요 저항은 $0.095 근처입니다. 더 많은 이익이 발생하면 가격이 $0.105 수준으로 떨어질 수 있습니다.
More Downsides in DOGE?
DOGE의 단점이 더 있나요?
If DOGE’s price fails to gain pace above the $0.0875 level, it could start a fresh decline. Initial support on the downside is near the $0.080 level.
DOGE의 가격이 $0.0875 수준 이상으로 상승하지 못하면 새로운 하락이 시작될 수 있습니다. 하락세에 대한 초기 지지는 $0.080 수준에 가깝습니다.
The next major support is near the $0.0760 level. If there is a downside break below the $0.0760 support, the price could decline further. In the stated case, the price might decline toward the $0.0710 level.
다음 주요 지원은 $0.0760 수준에 가깝습니다. $0.0760 지지선 아래로 하락 돌파가 있을 경우 가격은 더욱 하락할 수 있습니다. 명시된 경우 가격은 $0.0710 수준으로 하락할 수 있습니다.
Technical Indicators
기술 지표
4 Hours MACD – The MACD for DOGE/USD is now gaining momentum in the bearish zone.
4시간 MACD – DOGE/USD의 MACD는 이제 약세 영역에서 추진력을 얻고 있습니다.
4 Hours RSI (Relative Strength Index) – The RSI for DOGE/USD is now below the 50 level.
4시간 RSI(상대 강도 지수) – DOGE/USD의 RSI는 이제 50 수준 미만입니다.
Major Support Levels – $0.080, $0.0760, and $0.0710.
주요 지원 수준 - $0.080, $0.0760 및 $0.0710.
Major Resistance Levels – $0.0875, $0.0920, and $0.0950.
주요 저항 수준 – $0.0875, $0.0920, $0.0950.


 DeFi Planet
 Crypto Daily™
 BlockchainReporter
 TheCoinrise Media
 DogeHome
 Crypto Daily™
 Crypto Daily™
 TheCoinrise Media


