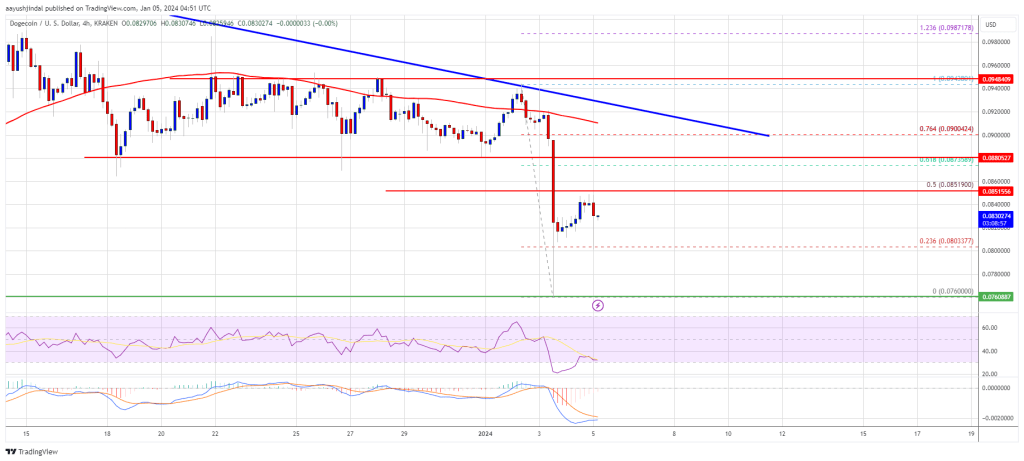
Dogecoin started a fresh decline from the $0.0950 resistance against the US Dollar. DOGE could extend its decline unless there is a close above $0.090.
ドージコインは対米ドルで0.0950ドルの抵抗線から新たな下落を開始した。 DOGEは終値が0.090ドルを超えない限り、下落を拡大する可能性がある。
- DOGE struggled near $0.0950 and started a fresh decline against the US dollar.
- The price is trading below the $0.090 level and the 100 simple moving average (4 hours).
- There is a key bearish trend line forming with resistance near $0.0920 on the 4-hour chart of the DOGE/USD pair (data source from Kraken).
- The price could start a recovery wave if it clears $0.090 and $0.0950.
DOGEは0.0950ドル付近で苦戦し、対米ドルで新たな下落を始めた。
価格は0.090ドルのレベルと100単純移動平均(4時間)を下回って取引されている。
DOGE/USDペアの4時間足チャートには、0.0920ドル付近に抵抗線を形成する主要な弱気トレンドラインが存在します(データソースはKraken)。
価格が0.090ドルと0.0950ドルをクリアすれば回復波が始まる可能性がある。
Dogecoin Price Faces Key Hurdles
ドージコインの価格が主要なハードルに直面
In the past few sessions, Dogecoin price struggled to gain pace above $0.0920. DOGE remained below the $0.095 resistance zone and started a fresh decline, like Bitcoin and Ethereum.
過去数回のセッションで、ドージコインの価格は0.0920ドルを超えるペースを得るのに苦労しました。 DOGEは0.095ドルのレジスタンスゾーンを下回ったままであり、ビットコインやイーサリアムと同様に新たな下落を開始しました。
There was a sharp drop below the $0.0900 and $0.0865 support levels. It even tested the $0.0760 zone. A low was formed near $0.0760, and the price is now attempting a recovery wave. There was a move above the $0.080 resistance zone.
0.0900ドルと0.0865ドルのサポートレベルを下回る急落がありました。 0.0760ドルのゾーンも試した。安値は0.0760ドル付近で形成され、価格は現在回復波を試みている。 0.080ドルのレジスタンスゾーンを超える動きがあった。
It cleared the 23.6% Fib retracement level of the downward move from the $0.0943 swing high to the $0.0760 low. DOGE is now trading below the $0.090 level and the 100 simple moving average (4 hours). There is also a key bearish trend line forming with resistance near $0.0920 on the 4-hour chart of the DOGE/USD pair.
0.0943ドルのスイング高値から0.0760ドルの安値までの下降動きの23.6%Fibリトレースメントレベルをクリアした。 DOGEは現在、0.090ドルのレベルと100単純移動平均(4時間)を下回って取引されています。 DOGE/USDペアの4時間足チャートには、0.0920ドル付近に抵抗線を形成する重要な弱気トレンドラインも存在する。
On the upside, the price is facing resistance near the $0.0875 level. It is close to the 61.8% Fib retracement level of the downward move from the $0.0943 swing high to the $0.0760 low. The next major resistance is near the $0.090 level.
上値では、価格は0.0875ドルレベル付近の抵抗線に直面している。これは、0.0943ドルのスイング高値から0.0760ドルの安値までの下降の61.8%Fibリトレースメントレベルに近い。次の主要な抵抗線は0.090ドルレベル付近です。
Source: DOGEUSD on TradingView.com
出典: TradingView.comのDOGEUSD
A close above the $0.090 resistance might send the price toward the $0.092 resistance. The next major resistance is near $0.095. Any more gains might send the price toward the $0.105 level.
終値が0.090ドルの抵抗線を上回った場合、価格は0.092ドルの抵抗線に向かう可能性があります。次の主要な抵抗線は0.095ドル付近です。さらに上昇すると、価格は0.105ドルのレベルに向かう可能性があります。
More Downsides in DOGE?
DOGEのさらなる欠点は?
If DOGE’s price fails to gain pace above the $0.0875 level, it could start a fresh decline. Initial support on the downside is near the $0.080 level.
DOGE価格が0.0875ドルのレベルを上回るペースで上昇できなければ、新たな下落が始まる可能性がある。下値支持線は0.080ドル付近にある。
The next major support is near the $0.0760 level. If there is a downside break below the $0.0760 support, the price could decline further. In the stated case, the price might decline toward the $0.0710 level.
次の主要なサポートは0.0760ドルレベル付近です。 0.0760ドルのサポートを下回る下値ブレイクがあれば、価格はさらに下落する可能性がある。上記のケースでは、価格は 0.0710 ドルのレベルに向かって下落する可能性があります。
Technical Indicators
テクニカル指標
4 Hours MACD – The MACD for DOGE/USD is now gaining momentum in the bearish zone.
4時間MACD – DOGE/USDのMACDは現在、弱気ゾーンで勢いを増しています。
4 Hours RSI (Relative Strength Index) – The RSI for DOGE/USD is now below the 50 level.
4 時間 RSI (相対力指数) – DOGE/USD の RSI は現在 50 レベルを下回っています。
Major Support Levels – $0.080, $0.0760, and $0.0710.
メジャーサポートレベル – $0.080、$0.0760、および $0.0710。
Major Resistance Levels – $0.0875, $0.0920, and $0.0950.
主要なレジスタンスレベル – 0.0875ドル、0.0920ドル、0.0950ドル。


 DeFi Planet
 Crypto Daily™
 BlockchainReporter
 TheCoinrise Media
 DogeHome
 Crypto Daily™
 Crypto Daily™
 TheCoinrise Media


