


The significant resurgence in Bitcoin (BTC) and specific alternative cryptocurrencies indicates that bullish sentiment continues to prevail, with investors consistently showing interest in purchasing these assets at reduced prices.
El importante resurgimiento del Bitcoin (BTC) y de criptomonedas alternativas específicas indica que el sentimiento alcista sigue prevaleciendo, y los inversores muestran constantemente interés en comprar estos activos a precios reducidos.
Traders generally have a solid aversion to uncertainty, so the recent resolution between Binance, Changpeng “CZ” Zhao, and the United States Department of Justice will likely foster a positive outlook for the cryptocurrency market. Most analysts have expressed optimism regarding this development, although a minority have voiced caution, citing the ongoing lawsuit by the Securities and Exchange Commission against Binance.
Los comerciantes generalmente tienen una sólida aversión a la incertidumbre, por lo que la reciente resolución entre Binance, Changpeng “CZ” Zhao y el Departamento de Justicia de los Estados Unidos probablemente fomentará una perspectiva positiva para el mercado de las criptomonedas. La mayoría de los analistas han expresado optimismo con respecto a este desarrollo, aunque una minoría ha expresado cautela, citando la demanda en curso de la Comisión de Bolsa y Valores contra Binance.
On November 21st, Bitcoin and various major alternative cryptocurrencies experienced a substantial decline in value following the Binance-related news. However, it appears traders swiftly intervened after the initial knee-jerk reaction, taking advantage of the lower prices. Following this initial rebound, the bullish momentum is anticipated to encounter significant resistance from bearish forces.
El 21 de noviembre, Bitcoin y varias criptomonedas alternativas importantes experimentaron una caída sustancial de su valor tras las noticias relacionadas con Binance. Sin embargo, parece que los comerciantes intervinieron rápidamente después de la reacción instintiva inicial, aprovechando los precios más bajos. Tras este rebote inicial, se prevé que el impulso alcista encontrará una resistencia significativa por parte de las fuerzas bajistas.
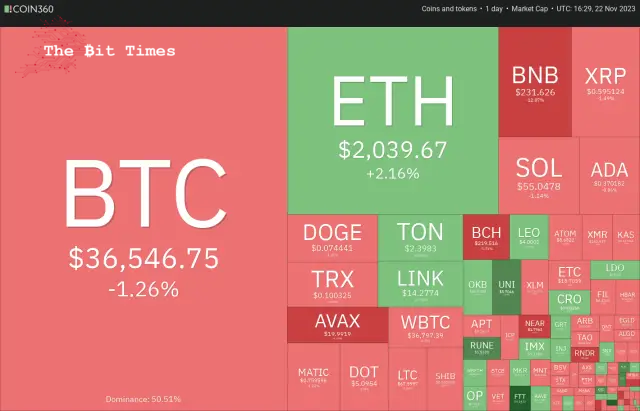
Buying on dips and selling on rallies results in a range-bound action as both the bulls and the bears battle it for supremacy. Generally, a consolidation near the 52-week high is considered a bullish sign, but traders should wait for an upside confirmation before jumping in to buy.
Comprar en las caídas y vender en las subidas da como resultado una acción dentro de un rango en el que tanto los alcistas como los bajistas luchan por la supremacía. Generalmente, una consolidación cerca del máximo de 52 semanas se considera una señal alcista, pero los operadores deberían esperar una confirmación alcista antes de lanzarse a comprar.
Will Bitcoin and select altcoins remain stuck inside a range for the next few days? What are the critical levels to watch out for?
¿Bitcoin y algunas altcoins seleccionadas permanecerán estancadas dentro de un rango durante los próximos días? ¿Cuáles son los niveles críticos a tener en cuenta?
Let’s analyse the charts of the top 10 cryptocurrencies to find out.
Analicemos los gráficos de las 10 principales criptomonedas para descubrirlo.
Bitcoin (BTC) price analysis
Análisis de precios de Bitcoin (BTC)
The bears pulled Bitcoin below the 20-day exponential moving average ($35,948) on Nov 21st but could not sustain the lower levels. Strong buying by the bulls pushed the price back above the 20-day EMA on Nov 22nd.
Los bajistas llevaron a Bitcoin por debajo del promedio móvil exponencial de 20 días ($35,948) el 21 de noviembre, pero no pudieron mantener los niveles más bajos. Las fuertes compras por parte de los alcistas hicieron que el precio volviera a superar la EMA de 20 días el 22 de noviembre.
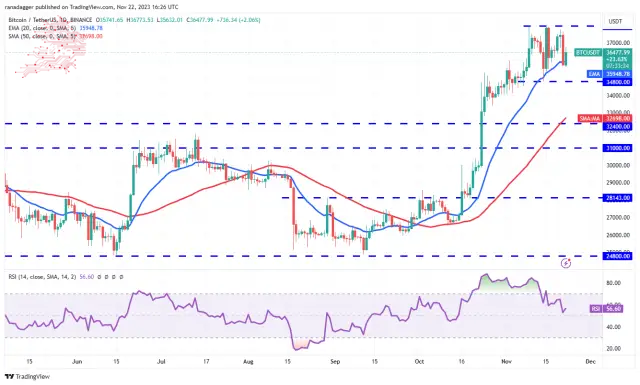
The BTC/USDT pair has been consolidating between $34,800 and $38,000 for several days. This indicates a balance between supply and demand. A minor positive in favour of the bulls is that the 20-day EMA slows up, and the relative strength index (RSI) remains in the positive zone.
El par BTC/USDT se ha estado consolidando entre $34,800 y $38,000 durante varios días. Esto indica un equilibrio entre la oferta y la demanda. Un pequeño aspecto positivo a favor de los alcistas es que la EMA de 20 días se desacelera y el índice de fuerza relativa (RSI) se mantiene en la zona positiva.
If bulls propel the price above $38,000, the pair could start the next leg of the uptrend to $40,000. This level may act as a formidable resistance, but the team may soar to $48,000 if cleared.
Si los alcistas impulsan el precio por encima de los 38.000 dólares, el par podría iniciar el siguiente tramo de la tendencia alcista hasta los 40.000 dólares. Este nivel puede actuar como una resistencia formidable, pero el equipo puede dispararse a $48,000 si se supera.
On the contrary, if the price turns down and breaks below $34,800, it will suggest that the traders are rushing to the exit. That may open the doors for a further decline to $32,400.
Por el contrario, si el precio baja y cae por debajo de $ 34,800, sugerirá que los operadores se apresuran hacia la salida. Eso puede abrir las puertas a una nueva caída hasta los 32.400 dólares.
Ether (ETH) price analysis
Análisis de precios de éter (ETH)
Ether turned down from the resistance line on Nov 20th and slipped below the 20-day EMA ($1,957) on Nov 21st.
Ether bajó de la línea de resistencia el 20 de noviembre y cayó por debajo de la EMA de 20 días ($1,957) el 21 de noviembre.
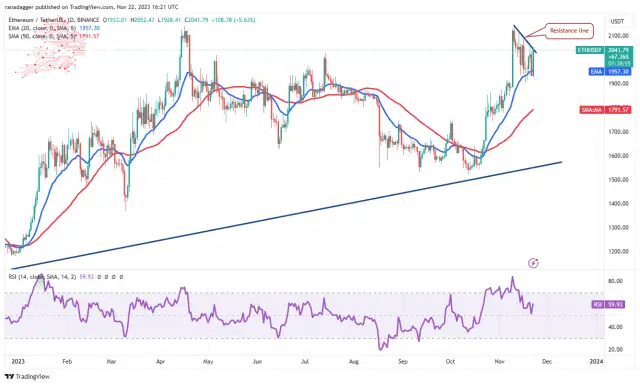
However, the bulls had other plans. They aggressively purchased the drop below the 20-day EMA and are again trying to overcome the barrier at the resistance line. This remains a pivotal level to watch because a break above it could start a rally to $2,137 and then to $2,200.
Sin embargo, los alcistas tenían otros planes. Compraron agresivamente la caída por debajo de la EMA de 20 días y nuevamente están tratando de superar la barrera en la línea de resistencia. Este sigue siendo un nivel fundamental al que hay que prestar atención porque una ruptura por encima de él podría iniciar un repunte hasta los 2.137 dólares y luego hasta los 2.200 dólares.
On the downside, $1,880 is a necessary support to watch out for. If this level fails, the ETH/USDT pair may start a deeper correction to the 50-day simple moving average ($1,791). That could delay the start of the next leg of the up-move.
En el lado negativo, 1.880$ es un soporte necesario al que hay que prestar atención. Si este nivel falla, el par ETH/USDT puede iniciar una corrección más profunda hacia el promedio móvil simple de 50 días ($1,791). Eso podría retrasar el inicio del siguiente tramo del movimiento ascendente.
BNB price analysis
Análisis de precios de BNB
BNB fue testigo de un viaje salvaje el 21 de noviembre, con un máximo intradiario de 272 dólares y un mínimo de 224 dólares. Esto indica incertidumbre sobre el próximo movimiento direccional entre alcistas y bajistas.
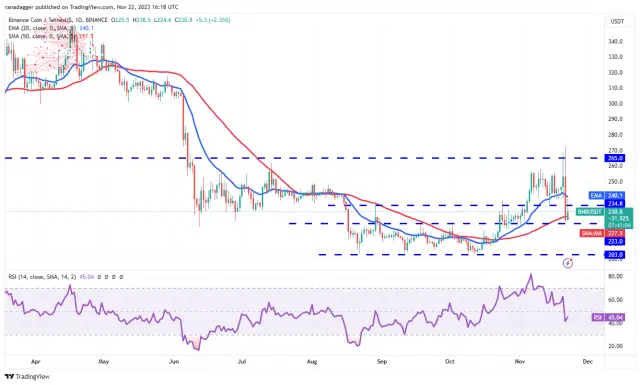
A minor positive is that the bulls did not allow the price to break below the significant support at $223. That started a recovery on Nov 22nd, and the bulls are trying to push the price back above the 20-day EMA ($240). If they succeed, it will signal that the BNB/USDT pair may consolidate between $223 and $265 for some time.
Un aspecto positivo menor es que los alcistas no permitieron que el precio cayera por debajo del soporte significativo de 223 dólares. Eso inició una recuperación el 22 de noviembre, y los alcistas están tratando de hacer que el precio vuelva a superar la EMA de 20 días ($240). Si tienen éxito, indicará que el par BNB/USDT puede consolidarse entre $223 y $265 durante algún tiempo.
Conversely, if the price fails to sustain above the 20-day EMA, it will suggest that bears are selling on rallies. That could again pull the price toward $223. A break below this support could extend the fall to $203.
Por el contrario, si el precio no logra mantenerse por encima de la EMA de 20 días, sugerirá que los bajistas están vendiendo en los repuntes. Eso podría volver a llevar el precio hacia los 223 dólares. Una ruptura por debajo de este soporte podría extender la caída a 203 dólares.
XRP price analysis
Análisis de precios XRP
XRP turned down from the 20-day EMA ($0.61) on Nov 20th and fell to the 50-day SMA ($0.57) on Nov 21st.
XRP bajó desde la EMA de 20 días ($0,61) el 20 de noviembre y cayó a la SMA de 50 días ($0,57) el 21 de noviembre.
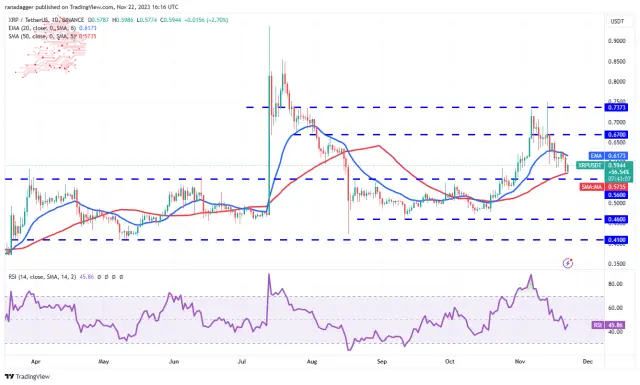
The bulls are expected to defend the support at $0.56 because a failure to do so may result in a drop toward $0.46. The slightly downsloping 20-day EMA and the RSI just below the midpoint indicate a minor advantage to the bears.
Se espera que los alcistas defiendan el soporte de 0,56 dólares porque si no lo hacen puede resultar en una caída hacia 0,46 dólares. La EMA de 20 días ligeramente descendente y el RSI justo por debajo del punto medio indican una ventaja menor para los bajistas.
If the price breaks above the 20-day EMA, it will suggest strong buying at lower levels. That will signal a possible range-bound action between $0.56 and $0.74 for a few days. The bulls will return to the driver’s seat after the XRP/USDT pair rises above $0.74.
Si el precio supera la EMA de 20 días, sugerirá compras fuertes en niveles más bajos. Eso indicará una posible acción dentro del rango entre $0,56 y $0,74 durante unos días. Los alcistas volverán al asiento del conductor después de que el par XRP/USDT supere los USD 0,74.
Solana (SOL) price analysis
Análisis de precios de Solana (SOL)
Solana climbed above the critical overhead resistance of $0.59 on Nov 19th, but the bulls could not build upon this strength. The bears pulled the price back below $0.59 on Nov 20th.
Solana superó la resistencia crítica de 0,59 dólares el 19 de noviembre, pero los alcistas no pudieron aprovechar esta fortaleza. Los bajistas volvieron a bajar el precio por debajo de 0,59 dólares el 20 de noviembre.
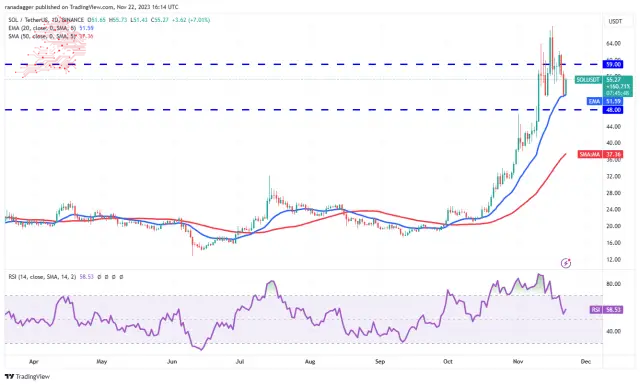
The SOL/USDT pair snapped back from the 20-day EMA ($51) on Nov 22nd, indicating that the bulls vigorously protect the level. Buyers will again try to overcome the obstacle at $59 and challenge the local high at $68.
El par SOL/USDT se recuperó de la EMA de 20 días ($51) el 22 de noviembre, lo que indica que los alcistas protegen vigorosamente el nivel. Los compradores intentarán nuevamente superar el obstáculo de 59 dólares y desafiar el máximo local de 68 dólares.
On the contrary, if the price again turns down from $59, it will suggest that bears remain active at higher levels. Sellers will again attempt to sink the price below the vital support at $48. If this level allows, the pair may nosedive to the 50-day SMA ($37).
Por el contrario, si el precio vuelve a bajar desde $59, sugerirá que los bajistas permanecen activos en niveles más altos. Los vendedores intentarán nuevamente hundir el precio por debajo del soporte vital de 48 dólares. Si este nivel lo permite, el par puede caer en picada hasta la SMA de 50 días ($37).
Cardano (ADA) price analysis
Análisis de precios de Cardano (ADA)
Repeated failures of the bulls to maintain Cardano above the breakout level of $0.38 started a correction on Nov 21st.
Los repetidos fracasos de los alcistas para mantener a Cardano por encima del nivel de ruptura de 0,38 dólares iniciaron una corrección el 21 de noviembre.
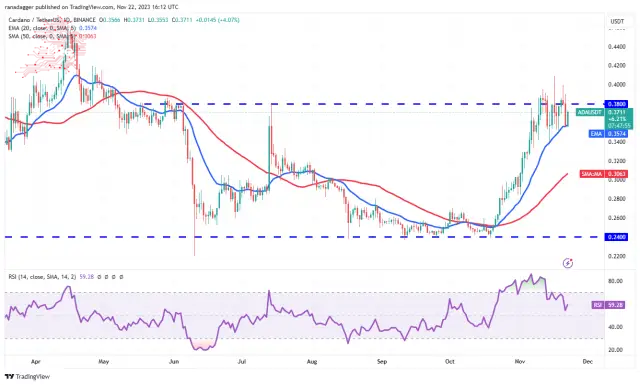
The price reached the 20-day EMA ($0.35), a strong support. The sharp rebound off this level suggests robust buying by the bulls. It also increases the likelihood of a break above $0.39. If this level is scaled, the ADA/USDT pair could rise to $0.46.
El precio alcanzó la EMA de 20 días ($0,35), un fuerte soporte. El fuerte rebote desde este nivel sugiere compras sólidas por parte de los alcistas. También aumenta la probabilidad de una ruptura por encima de 0,39 dólares. Si se escala este nivel, el par ADA/USDT podría subir a $0,46.
Bears must quickly drag the price below the 20-day EMA if they want to prevent the rally. There is minor support at $0.34, but if it cracks, the pair may slide to the 50-day SMA ($0.30).
Los bajistas deben arrastrar rápidamente el precio por debajo de la EMA de 20 días si quieren evitar el repunte. Hay un soporte menor en USD 0,34, pero si se rompe, el par puede deslizarse hasta la SMA de 50 días (USD 0,30).
Dogecoin (DOGE) price analysis
Análisis de precios de Dogecoin (DOGE)
Dogecoin plunged below the 20-day EMA ($0.07) on Nov 21st, but the bears struggle to sustain the lower levels.
Dogecoin se hundió por debajo de la EMA de 20 días (0,07 dólares) el 21 de noviembre, pero los bajistas luchan por mantener los niveles más bajos.
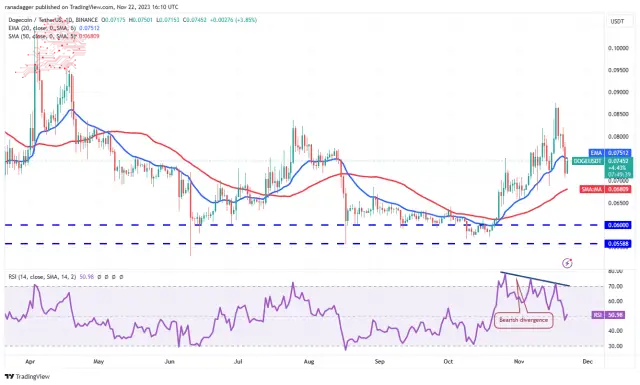
The bulls are trying to push the DOGE/USDT pair back above the 20-day EMA. It will suggest aggressive buying on dips if they can pull it off. The bulls will then make one more attempt to clear the overhead hurdle at $0.08 and start the march toward $0.10.
Los alcistas están intentando hacer que el par DOGE/USDT vuelva a superar la EMA de 20 días. Sugerirá compras agresivas en las caídas si pueden lograrlo. Luego, los alcistas harán un intento más de superar el obstáculo superior de 0,08 dólares y comenzarán la marcha hacia 0,10 dólares.
Alternatively, the bears will try to sell the rallies and keep the price pinned below the 20-day EMA. That could open the doors for a potential drop to the 50-day SMA ($0.07) and eventually to the crucial support at $0.06.
Alternativamente, los bajistas intentarán vender los repuntes y mantener el precio fijado por debajo de la EMA de 20 días. Eso podría abrir las puertas a una posible caída hasta la SMA de 50 días (USD 0,07) y, finalmente, hasta el soporte crucial de USD 0,06.
Toncoin (TON) price analysis
Toncoin has been finding support at the 50-day SMA ($2.19), indicating that the sentiment remains positive and traders buy on dips.
Análisis de precios de Toncoin (TON) Toncoin ha encontrado soporte en la SMA de 50 días ($2,19), lo que indica que el sentimiento sigue siendo positivo y los operadores compran en las caídas.
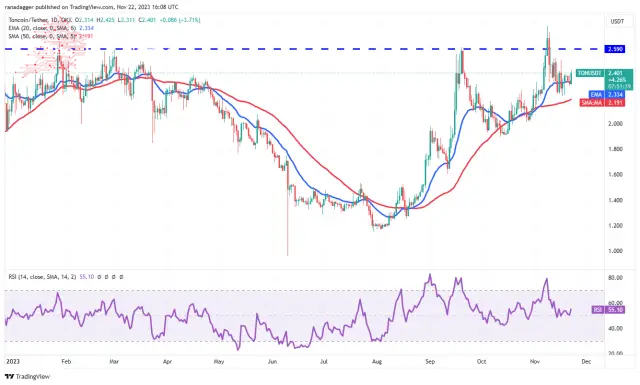
Both moving averages remain flattish, and the RSI is just above the midpoint, indicating a range-bound action in the short term. If the price is above $2.40, the TON/USDT pair may rise to $2.59.
Ambos promedios móviles se mantienen planos y el RSI está justo por encima del punto medio, lo que indica una acción dentro del rango en el corto plazo. Si el precio está por encima de $2,40, el par TON/USDT puede subir a $2,59.
Contrary to this assumption, if the price breaks below the 20-day EMA, the pair could test the support at the 50-day SMA. The pair may move downward to $2 and $1.89 if this support cracks.
Contrariamente a esta suposición, si el precio cae por debajo de la EMA de 20 días, el par podría probar el soporte en la SMA de 50 días. El par puede bajar a $2 y $1,89 si este soporte se rompe.
Chainlink (LINK) price analysis
Chainlink turned down from the immediate resistance of $15.39 on Nov 20th and fell below the 20-day EMA ($13.63) on Nov 21st.
Análisis de precios de Chainlink (LINK) Chainlink bajó de la resistencia inmediata de $ 15,39 el 20 de noviembre y cayó por debajo de la EMA de 20 días ($ 13,63) el 21 de noviembre.
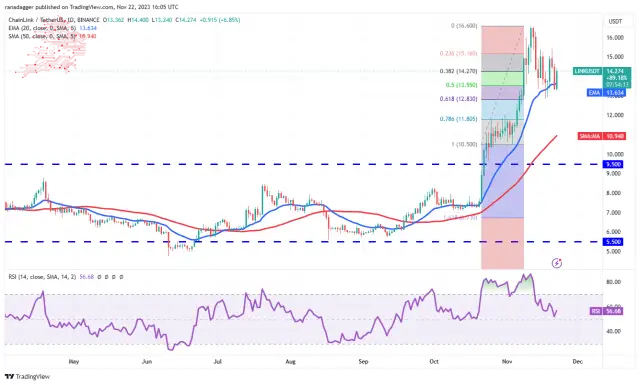
The LINK/USDT pair rebounded above the 20-day EMA on Nov 22nd, indicating demand at lower levels. Buyers will again try to propel the price above $15.39 and retest the overhead resistance at $16.60.
El par LINK/USDT rebotó por encima de la EMA de 20 días el 22 de noviembre, lo que indica que la demanda se encuentra en niveles más bajos. Los compradores intentarán nuevamente impulsar el precio por encima de 15,39 dólares y volver a probar la resistencia superior en 16,60 dólares.
Meanwhile, the bears are likely to have other plans. They will try to defend the $15.39 level and pull the price below the 61.8% Fibonacci retracement level of $12.83. The pair may plummet to the 50-day SMA ($10.94) if they do that.
Mientras tanto, es probable que los bajistas tengan otros planes. Intentarán defender el nivel de 15,39 dólares y llevar el precio por debajo del nivel de retroceso de Fibonacci del 61,8% de 12,83 dólares. El par puede caer en picado hasta la SMA de 50 días (USD 10,94) si lo hace.
Avalanche (AVAX) price analysis
Análisis de precios de Avalancha (AVAX)
Avalanche closed above the $10.52 to $22 range on Nov 19th, but the bulls could not maintain the higher levels. The bears pulled the price back below the breakout level on Nov 20th.
Avalanche cerró por encima del rango de 10,52 a 22 dólares el 19 de noviembre, pero los alcistas no pudieron mantener los niveles más altos. Los bajistas volvieron a bajar el precio por debajo del nivel de ruptura el 20 de noviembre.
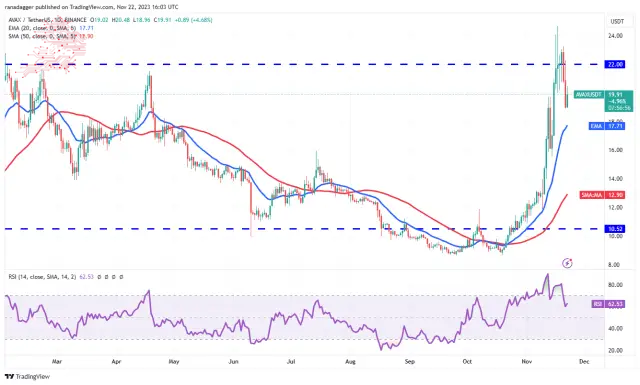
The 20-day EMA ($17.71) slows up, and the RSI is in positive territory, indicating that the bulls have the upper hand. Buyers will again try to propel the price above $22, and if they are successful, it will suggest the start of a new up-move. The AVAX/USDT pair could then start its journey toward $30.
La EMA de 20 días ($17,71) se desacelera y el RSI está en territorio positivo, lo que indica que los alcistas tienen la ventaja. Los compradores intentarán nuevamente impulsar el precio por encima de los 22 dólares y, si tienen éxito, sugerirán el inicio de un nuevo movimiento alcista. El par AVAX/USDT podría entonces comenzar su viaje hacia los 30 dólares.
Contrarily, if the price turns down from $22, it will indicate that the bears vigorously protect the level. That will increase the possibility of a break below the 20-day EMA. If that happens, the pair may remain stuck inside the extensive range longer.
Por el contrario, si el precio baja de 22 dólares, indicará que los bajistas protegen vigorosamente el nivel. Eso aumentará la posibilidad de una ruptura por debajo de la EMA de 20 días. Si eso sucede, el par puede permanecer estancado dentro del rango extenso por más tiempo.
Source – Rakesh Upadhyay
Fuente - Rakesh Upadhyay
Source: https://thebittimes.com/latest-market-overview-22nd-nov-btc-eth-bnb-xrp-sol-ada-doge-ton-link-avax-tbt71288.html
Fuente: https://thebittimes.com/latest-market-overview-22nd-nov-btc-eth-bnb-xrp-sol-ada-doge-ton-link-avax-tbt71288.html
 Crypto Intelligence
 DogeHome
 Crypto News Land
 Crypto Daily™
 Crypto Intelligence
 Crypto Daily™
 CaptainAltcoin
 Thecryptoupdates
 Crypto Intelligence


