
The significant resurgence in Bitcoin (BTC) and specific alternative cryptocurrencies indicates that bullish sentiment continues to prevail, with investors consistently showing interest in purchasing these assets at reduced prices.
比特幣(BTC)和特定替代加密貨幣的大幅復甦表明看漲情緒繼續盛行,投資者始終表現出以較低價格購買這些資產的興趣。
Traders generally have a solid aversion to uncertainty, so the recent resolution between Binance, Changpeng “CZ” Zhao, and the United States Department of Justice will likely foster a positive outlook for the cryptocurrency market. Most analysts have expressed optimism regarding this development, although a minority have voiced caution, citing the ongoing lawsuit by the Securities and Exchange Commission against Binance.
交易者普遍厭惡不確定性,因此幣安、趙長鵬和美國司法部最近達成的決議可能會促進加密貨幣市場的積極前景。大多數分析師對這一發展表示樂觀,但也有少數分析師表示謹慎,理由是美國證券交易委員會正在對幣安提起訴訟。
On November 21st, Bitcoin and various major alternative cryptocurrencies experienced a substantial decline in value following the Binance-related news. However, it appears traders swiftly intervened after the initial knee-jerk reaction, taking advantage of the lower prices. Following this initial rebound, the bullish momentum is anticipated to encounter significant resistance from bearish forces.
11 月 21 日,幣安相關消息傳出後,比特幣和各種主要替代加密貨幣的價值大幅下跌。然而,在最初的本能反應之後,交易商似乎利用較低的價格迅速進行了乾預。在最初的反彈之後,看漲勢頭預計將遇到看跌力量的重大阻力。
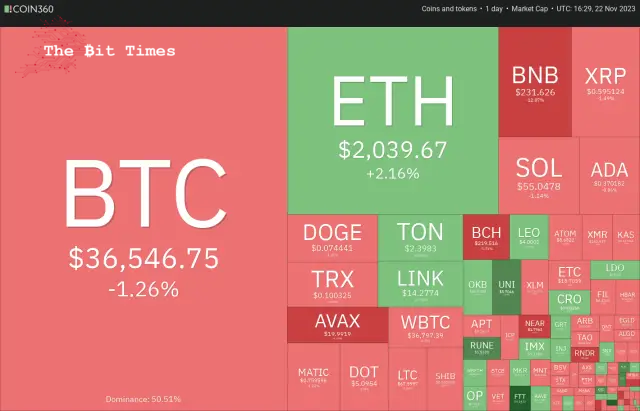
Buying on dips and selling on rallies results in a range-bound action as both the bulls and the bears battle it for supremacy. Generally, a consolidation near the 52-week high is considered a bullish sign, but traders should wait for an upside confirmation before jumping in to buy.
逢低買入和逢高賣出會導致區間波動,因為多頭和空頭都在爭奪霸主地位。一般來說,在 52 週高點附近盤整被認為是看漲訊號,但交易者應等待上行確認後再買入。
Will Bitcoin and select altcoins remain stuck inside a range for the next few days? What are the critical levels to watch out for?
在接下來的幾天裡,比特幣和部分山寨幣是否會繼續停留在區間?需要注意的關鍵水平是什麼?
Let’s analyse the charts of the top 10 cryptocurrencies to find out.
讓我們分析一下前 10 名加密貨幣的圖表來找出答案。
Bitcoin (BTC) price analysis
比特幣(BTC)價格分析
The bears pulled Bitcoin below the 20-day exponential moving average ($35,948) on Nov 21st but could not sustain the lower levels. Strong buying by the bulls pushed the price back above the 20-day EMA on Nov 22nd.
11 月 21 日,空頭將比特幣拉低至 20 天指數移動平均線(35,948 美元)以下,但無法維持較低水準。 11 月 22 日,多頭的強勁買盤將價格推回 20 日均線上方。
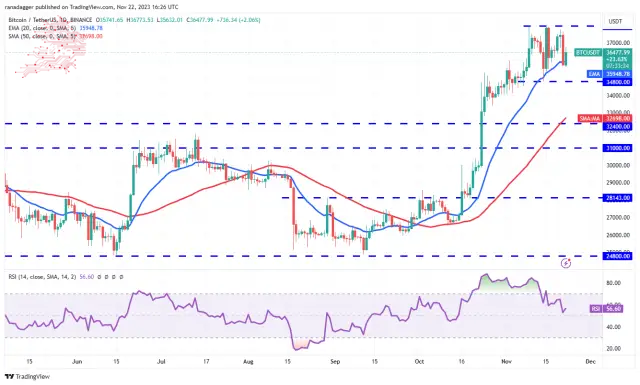
The BTC/USDT pair has been consolidating between $34,800 and $38,000 for several days. This indicates a balance between supply and demand. A minor positive in favour of the bulls is that the 20-day EMA slows up, and the relative strength index (RSI) remains in the positive zone.
BTC/USDT 貨幣對連續幾天在 34,800 美元至 38,000 美元之間盤整。這表示供需之間達到平衡。有利於多頭的一個小利好是 20 日均線放緩,相對強弱指數 (RSI) 仍處於正值區域。
If bulls propel the price above $38,000, the pair could start the next leg of the uptrend to $40,000. This level may act as a formidable resistance, but the team may soar to $48,000 if cleared.
如果多頭將價格推高至 38,000 美元以上,則該貨幣對可能會開始下一階段的上升趨勢至 40,000 美元。該水平可能會成為一個強大的阻力位,但如果清除,該團隊的股價可能會飆升至 48,000 美元。
On the contrary, if the price turns down and breaks below $34,800, it will suggest that the traders are rushing to the exit. That may open the doors for a further decline to $32,400.
相反,如果價格下跌並跌破34,800美元,則表示交易者正在急於退出。這可能為進一步下跌至 32,400 美元打開大門。
Ether (ETH) price analysis
以太幣(ETH)價格分析
Ether turned down from the resistance line on Nov 20th and slipped below the 20-day EMA ($1,957) on Nov 21st.
以太坊於 11 月 20 日從阻力線下跌,並於 11 月 21 日跌破 20 日均線(1,957 美元)。
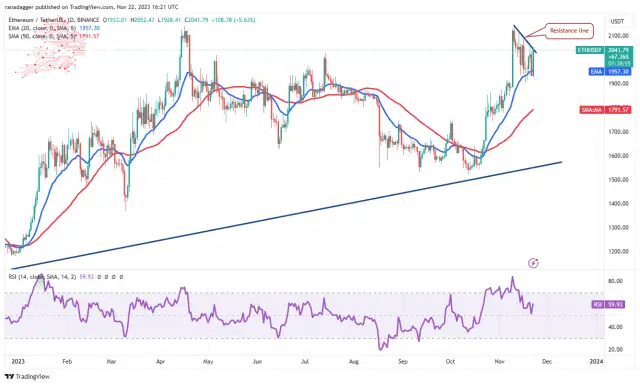
However, the bulls had other plans. They aggressively purchased the drop below the 20-day EMA and are again trying to overcome the barrier at the resistance line. This remains a pivotal level to watch because a break above it could start a rally to $2,137 and then to $2,200.
然而,公牛隊還有其他計劃。他們在 20 日均線下方積極買入,並再次試圖克服阻力線的障礙。這仍然是一個值得關注的關鍵水平,因為突破該水平可能會開始反彈至 2,137 美元,然後升至 2,200 美元。
On the downside, $1,880 is a necessary support to watch out for. If this level fails, the ETH/USDT pair may start a deeper correction to the 50-day simple moving average ($1,791). That could delay the start of the next leg of the up-move.
下檔方面,1,880 美元是值得關注的必要支撐位。如果這個等級失敗,ETH/USDT 貨幣對可能會開始對 50 日簡單移動平均線(1,791 美元)進行更深層的修正。這可能會推遲下一階段上漲的開始。
BNB price analysis
BNB價格分析
BNB 於 11 月 21 日經歷了瘋狂上漲,盤中最高價為 272 美元,最低價為 224 美元。這表明多頭和空頭之間的下一步走勢存在不確定性。
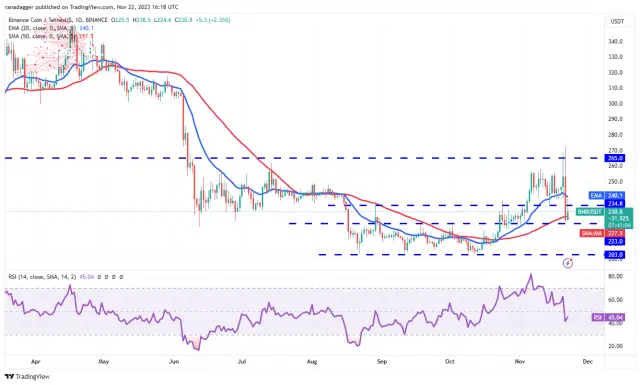
A minor positive is that the bulls did not allow the price to break below the significant support at $223. That started a recovery on Nov 22nd, and the bulls are trying to push the price back above the 20-day EMA ($240). If they succeed, it will signal that the BNB/USDT pair may consolidate between $223 and $265 for some time.
一個小的正面因素是,多頭不允許價格跌破 223 美元的重要支撐位。 11 月 22 日開始復甦,多頭正試圖將價格推回 20 日均線(240 美元)上方。如果成功,這將表明 BNB/USDT 貨幣對可能會在一段時間內在 223 美元至 265 美元之間盤整。
Conversely, if the price fails to sustain above the 20-day EMA, it will suggest that bears are selling on rallies. That could again pull the price toward $223. A break below this support could extend the fall to $203.
相反,如果價格未能維持在 20 日均線之上,則表示空頭正在逢高拋售。這可能會再次將價格推向 223 美元。跌破該支撐位可能會導致跌幅擴大至 203 美元。
XRP price analysis
瑞波幣價格分析
XRP turned down from the 20-day EMA ($0.61) on Nov 20th and fell to the 50-day SMA ($0.57) on Nov 21st.
XRP 從 11 月 20 日的 20 日均線(0.61 美元)下跌,並於 11 月 21 日跌至 50 日均線(0.57 美元)。
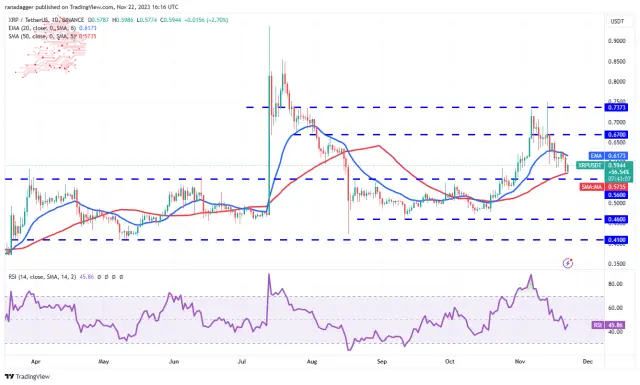
The bulls are expected to defend the support at $0.56 because a failure to do so may result in a drop toward $0.46. The slightly downsloping 20-day EMA and the RSI just below the midpoint indicate a minor advantage to the bears.
預計多頭將守住 0.56 美元的支撐位,因為如果未能做到這一點,可能會導致跌向 0.46 美元。略微向下傾斜的 20 日均線和略低於中點的 RSI 表明空頭有較小的優勢。
If the price breaks above the 20-day EMA, it will suggest strong buying at lower levels. That will signal a possible range-bound action between $0.56 and $0.74 for a few days. The bulls will return to the driver’s seat after the XRP/USDT pair rises above $0.74.
如果價格突破 20 日均線,則表示較低的強勁買盤。這將預示著幾天內可能在 0.56 美元至 0.74 美元之間波動。在 XRP/USDT 貨幣對升至 0.74 美元以上後,多頭將重新佔據主導地位。
Solana (SOL) price analysis
Solana (SOL) 價格分析
Solana climbed above the critical overhead resistance of $0.59 on Nov 19th, but the bulls could not build upon this strength. The bears pulled the price back below $0.59 on Nov 20th.
Solana 於 11 月 19 日攀升至 0.59 美元的關鍵上方阻力位,但多頭無法利用這一強勢。 11 月 20 日,空頭將價格拉回至 0.59 美元以下。
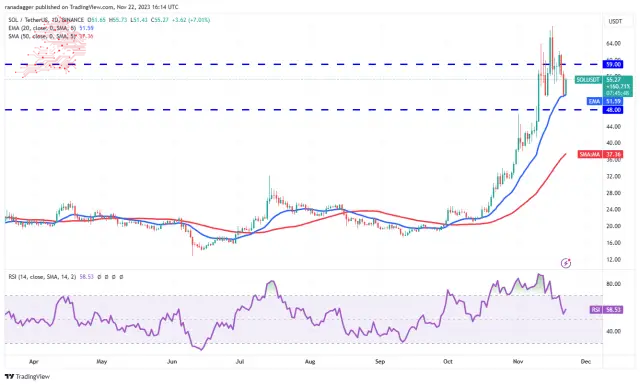
The SOL/USDT pair snapped back from the 20-day EMA ($51) on Nov 22nd, indicating that the bulls vigorously protect the level. Buyers will again try to overcome the obstacle at $59 and challenge the local high at $68.
SOL/USDT 貨幣對於 11 月 22 日從 20 日均線(51 美元)反彈,表明多頭大力保護該水平。買家將再次嘗試克服 59 美元的障礙,並挑戰 68 美元的局部高點。
On the contrary, if the price again turns down from $59, it will suggest that bears remain active at higher levels. Sellers will again attempt to sink the price below the vital support at $48. If this level allows, the pair may nosedive to the 50-day SMA ($37).
相反,如果價格再次從 59 美元下跌,則表明空頭在更高水平上仍然活躍。賣家將再次試圖將價格壓低至 48 美元的重要支撐位以下。如果該水準允許,該貨幣對可能會暴跌至 50 日移動平均線(37 美元)。
Cardano (ADA) price analysis
卡爾達諾(ADA)價格分析
Repeated failures of the bulls to maintain Cardano above the breakout level of $0.38 started a correction on Nov 21st.
多頭多次未能將卡爾達諾維持在 0.38 美元的突破水平上方,並於 11 月 21 日開始調整。
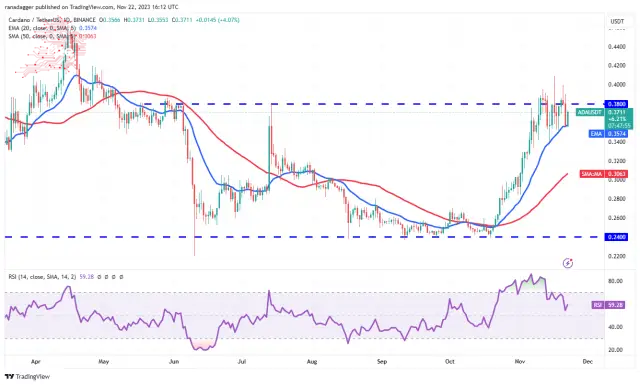
The price reached the 20-day EMA ($0.35), a strong support. The sharp rebound off this level suggests robust buying by the bulls. It also increases the likelihood of a break above $0.39. If this level is scaled, the ADA/USDT pair could rise to $0.46.
價格觸及 20 日均線(0.35 美元),這是一個強有力的支撐。從該水平大幅反彈表明多頭強勁買盤。它還增加了突破 0.39 美元的可能性。如果擴大這一水平,ADA/USDT 貨幣對可能會上漲至 0.46 美元。
Bears must quickly drag the price below the 20-day EMA if they want to prevent the rally. There is minor support at $0.34, but if it cracks, the pair may slide to the 50-day SMA ($0.30).
如果空頭想阻止反彈,就必須迅速將價格拖至 20 日均線下方。 0.34 美元有小支撐,但如果突破,該貨幣對可能會滑向 50 日移動平均線(0.30 美元)。
Dogecoin (DOGE) price analysis
狗狗幣 (DOGE) 價格分析
Dogecoin plunged below the 20-day EMA ($0.07) on Nov 21st, but the bears struggle to sustain the lower levels.
狗狗幣於 11 月 21 日跌破 20 日均線(0.07 美元),但空頭難以維持較低水準。
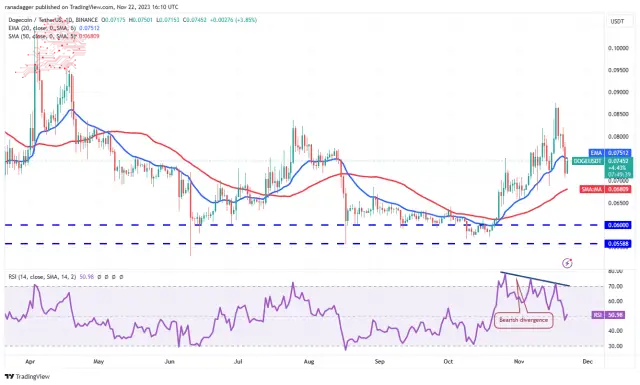
The bulls are trying to push the DOGE/USDT pair back above the 20-day EMA. It will suggest aggressive buying on dips if they can pull it off. The bulls will then make one more attempt to clear the overhead hurdle at $0.08 and start the march toward $0.10.
多頭正試圖將 DOGE/USDT 貨幣對推回 20 日均線上方。如果他們能成功的話,這將建議逢低積極買入。然後,多頭將再次嘗試清除 0.08 美元的上方障礙,並開始向 0.10 美元進軍。
Alternatively, the bears will try to sell the rallies and keep the price pinned below the 20-day EMA. That could open the doors for a potential drop to the 50-day SMA ($0.07) and eventually to the crucial support at $0.06.
或者,空頭將嘗試逢高賣出並將價格保持在 20 日均線下方。這可能為跌至 50 日移動平均線(0.07 美元)並最終跌至 0.06 美元的關鍵支撐位打開大門。
Toncoin (TON) price analysis
Toncoin has been finding support at the 50-day SMA ($2.19), indicating that the sentiment remains positive and traders buy on dips.
Toncoin (TON) 價格分析 Toncoin 一直在 50 日移動平均線(2.19 美元)處找到支撐,表明市場情緒仍然樂觀,交易者逢低買入。
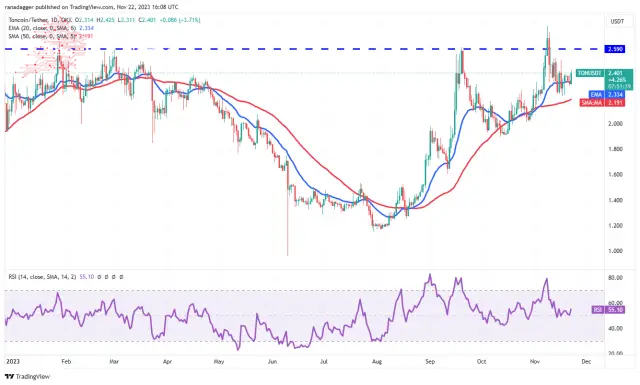
Both moving averages remain flattish, and the RSI is just above the midpoint, indicating a range-bound action in the short term. If the price is above $2.40, the TON/USDT pair may rise to $2.59.
兩條移動平均線均保持平穩,RSI 略高於中點,顯示短期內將出現區間波動。如果價格高於 2.40 美元,TON/USDT 貨幣對可能會上漲至 2.59 美元。
Contrary to this assumption, if the price breaks below the 20-day EMA, the pair could test the support at the 50-day SMA. The pair may move downward to $2 and $1.89 if this support cracks.
與此假設相反,如果價格跌破 20 日均線,該貨幣對可能會測試 50 日均線的支撐。如果該支撐位破裂,該貨幣對可能會下跌至 2 美元和 1.89 美元。
Chainlink (LINK) price analysis
Chainlink turned down from the immediate resistance of $15.39 on Nov 20th and fell below the 20-day EMA ($13.63) on Nov 21st.
Chainlink (LINK) 價格分析 Chainlink 從 11 月 20 日的直接阻力位 15.39 美元回落,並於 11 月 21 日跌破 20 日均線(13.63 美元)。
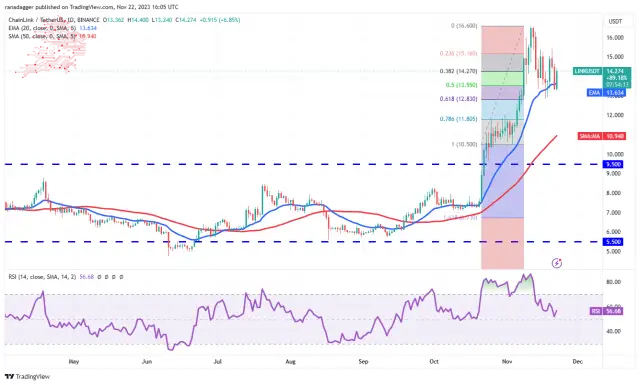
The LINK/USDT pair rebounded above the 20-day EMA on Nov 22nd, indicating demand at lower levels. Buyers will again try to propel the price above $15.39 and retest the overhead resistance at $16.60.
LINK/USDT 貨幣對於 11 月 22 日反彈至 20 日均線上方,顯示需求處於較低水準。買家將再次嘗試將價格推高至 15.39 美元上方,並重新測試上方阻力位 16.60 美元。
Meanwhile, the bears are likely to have other plans. They will try to defend the $15.39 level and pull the price below the 61.8% Fibonacci retracement level of $12.83. The pair may plummet to the 50-day SMA ($10.94) if they do that.
同時,空頭可能還有其他計劃。他們將努力守住 15.39 美元的水平,並將價格拉至 61.8% 斐波那契回檔位 12.83 美元以下。如果這樣做,該貨幣對可能會暴跌至 50 日移動平均線(10.94 美元)。
Avalanche (AVAX) price analysis
雪崩 (AVAX) 價格分析
Avalanche closed above the $10.52 to $22 range on Nov 19th, but the bulls could not maintain the higher levels. The bears pulled the price back below the breakout level on Nov 20th.
11 月 19 日,Avalanche 收盤於 10.52 美元至 22 美元區間之上,但多頭無法維持較高水準。空頭將價格拉回 11 月 20 日的突破水平以下。
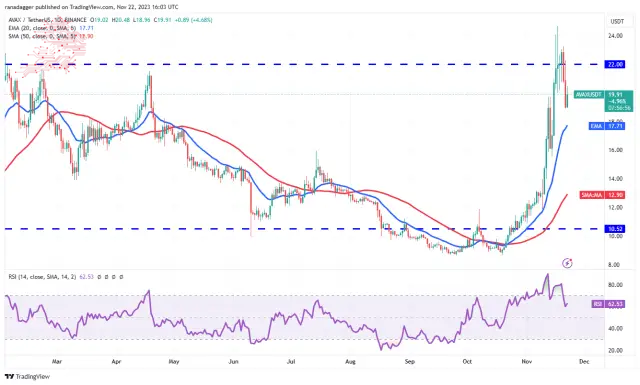
The 20-day EMA ($17.71) slows up, and the RSI is in positive territory, indicating that the bulls have the upper hand. Buyers will again try to propel the price above $22, and if they are successful, it will suggest the start of a new up-move. The AVAX/USDT pair could then start its journey toward $30.
20 日均線(17.71 美元)放緩,RSI 處於正值區域,表明多頭佔上風。買家將再次嘗試將價格推高至 22 美元以上,如果成功,則意味著新一輪上漲的開始。然後 AVAX/USDT 貨幣對可能會開始走向 30 美元。
Contrarily, if the price turns down from $22, it will indicate that the bears vigorously protect the level. That will increase the possibility of a break below the 20-day EMA. If that happens, the pair may remain stuck inside the extensive range longer.
相反,如果價格從 22 美元下跌,則表示空頭正在大力保護該水平。這將增加跌破20日均線的可能性。如果發生這種情況,該貨幣對可能會在廣泛的區間內停留更長時間。
Source – Rakesh Upadhyay
來源——Rakesh Upadhyay
Source: https://thebittimes.com/latest-market-overview-22nd-nov-btc-eth-bnb-xrp-sol-ada-doge-ton-link-avax-tbt71288.html
資料來源:https://thebittimes.com/latest-market-overview-22nd-nov-btc-eth-bnb-xrp-sol-ada-doge-ton-link-avax-tbt71288.html


 Crypto Daily™
 Crypto Daily™
 DogeHome
 TheCoinrise Media
 Thecoinrepublic.com
 TheCoinrise Media
 TheCoinrise Media
 Cryptopolitan_News


