

Bitcoin’s (BTC) recent fall does not seem to have dented the demand for the spot Bitcoin exchange-traded funds. After five days of successive net outflows last week, demand bounced back sharply with $418 million in net inflows into the ETFs on March 26 and $243 million inflows on March 27, according to Farside Investors data.
La reciente caída de Bitcoin (BTC) no parece haber afectado la demanda de los fondos cotizados en bolsa de Bitcoin. Después de cinco días de salidas netas sucesivas la semana pasada, la demanda se recuperó bruscamente con 418 millones de dólares en entradas netas a los ETF el 26 de marzo y entradas de 243 millones de dólares el 27 de marzo, según datos de Farside Investors.
BlackRock CEO Larry Fink said in an interview with Fox Business that he was “pleasantly surprised” with the performance of the firm’s spot Bitcoin ETF, which was the “fastest growing ETF in the history of ETFs.” Fink added that he was “very bullish on the long-term viability of Bitcoin.”
El director ejecutivo de BlackRock, Larry Fink, dijo en una entrevista con Fox Business que estaba "gratamente sorprendido" con el desempeño del ETF de Bitcoin al contado de la empresa, que fue el "ETF de más rápido crecimiento en la historia de los ETF". Fink añadió que era "muy optimista sobre la viabilidad a largo plazo de Bitcoin".
On-chain analytics platform CryptoQuant said in its latest “Weekly Crypto Report” that Bitcoin’s demand skyrocketed from “40K Bitcoin at the start of 2024 to 213K Bitcoin” on March 26. That could create a “sell-side liquidity crisis” within the next year.
La plataforma de análisis en cadena CryptoQuant dijo en su último "Informe criptográfico semanal" que la demanda de Bitcoin se disparó de "40.000 Bitcoin a principios de 2024 a 213.000 Bitcoin" el 26 de marzo. Eso podría crear una "crisis de liquidez del lado de las ventas" en el próximo año.
Could Bitcoin continue its recovery and hit a new all-time high before the Bitcoin halving? Will that trigger buying in altcoins? Let’s analyze the charts of the top 10 cryptocurrencies to find out.
¿Podría Bitcoin continuar su recuperación y alcanzar un nuevo máximo histórico antes de que Bitcoin se reduzca a la mitad? ¿Eso desencadenará la compra de altcoins? Analicemos los gráficos de las 10 principales criptomonedas para descubrirlo.
Bitcoin price analysis
Análisis de precios de Bitcoin
Bitcoin witnessed profit booking on March 26 and 27, but a positive sign is that the bulls maintained the price above the pennant.
Bitcoin fue testigo de la reserva de ganancias el 26 y 27 de marzo, pero una señal positiva es que los alcistas mantuvieron el precio por encima del banderín.
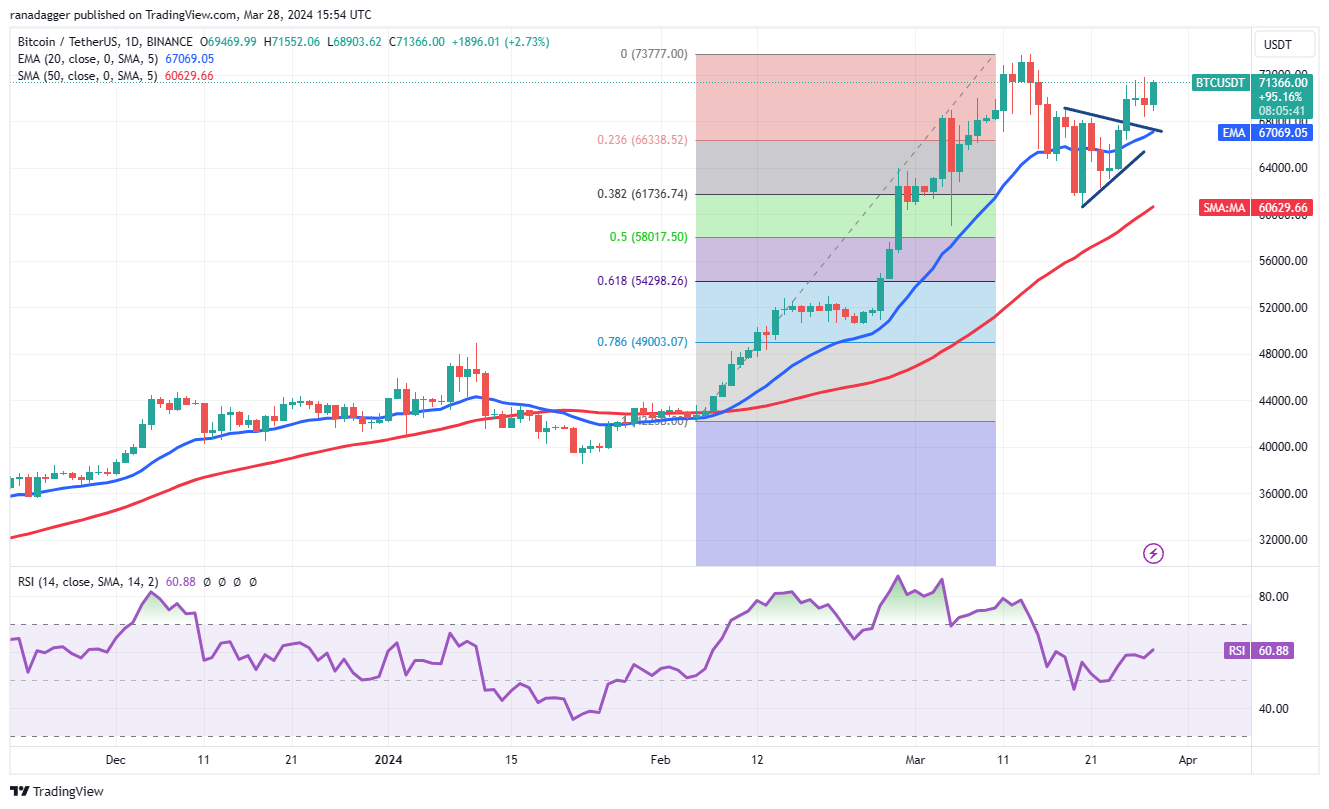
The 20-day exponential moving average (EMA) ($67,069) has started to turn up, and the relative strength index (RSI) is in the positive territory, suggesting that the path of least resistance is to the upside.
La media móvil exponencial (EMA) de 20 días (67.069 dólares) ha comenzado a subir y el índice de fuerza relativa (RSI) está en territorio positivo, lo que sugiere que el camino de menor resistencia es al alza.
If buyers drive the price above $73,777, the BTC/USDT pair is likely to pick up momentum and rally to $80,000.
Si los compradores elevan el precio por encima de los USD 73,777, es probable que el par BTC/USDT cobre impulso y suba a los USD 80,000.
On the contrary, if the price turns down from the current level and breaks below the 20-day EMA, it could open the doors for a potential drop to the 50-day simple moving average ($60,629).
Por el contrario, si el precio baja del nivel actual y cae por debajo de la EMA de 20 días, podría abrir las puertas a una posible caída hasta la media móvil simple de 50 días ($60,629).
Ether price analysis
Análisis de precios de éter
Ether (ETH) is facing selling near $3,678, but a positive sign is that the bulls are trying to defend the 20-day EMA ($3,530).
Ether (ETH) se enfrenta a una venta cercana a los 3.678 dólares, pero una señal positiva es que los alcistas están tratando de defender la EMA de 20 días (3.530 dólares).
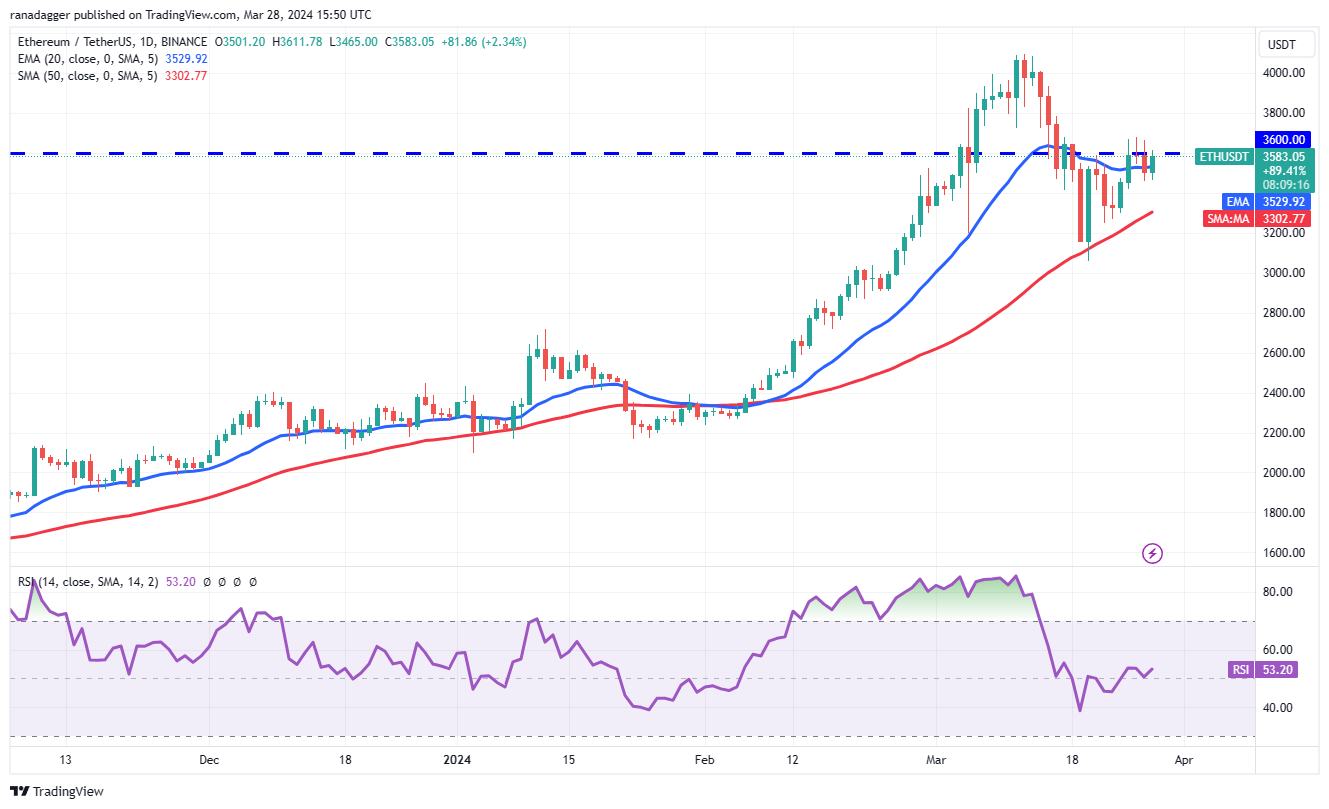
If the price breaks above $3,678, the possibility of a rally to $4,100 increases. This level may act as a stiff hurdle, but if the buyers prevail, the ETH/USDT pair could rally to $4,500 and then to $4,868.
Si el precio supera los $ 3,678, aumenta la posibilidad de un repunte a $ 4,100. Este nivel puede actuar como un obstáculo difícil, pero si los compradores prevalecen, el par ETH/USDT podría subir a $4,500 y luego a $4,868.
Conversely, if the price turns down sharply and breaks below $3,460, it will suggest that the bears are not willing to give up. The pair may then slip to the 50-day SMA ($3,302). A slide below this support could start a deeper correction.
Por el contrario, si el precio cae bruscamente y cae por debajo de $ 3,460, sugerirá que los bajistas no están dispuestos a darse por vencidos. Luego, el par puede caer hasta la SMA de 50 días ($3,302). Una caída por debajo de este soporte podría iniciar una corrección más profunda.
BNB price analysis
Análisis de precios de BNB
The long wick on BNB’s (BNB) March 25 and 26 candlestick shows that the bears are defending the 61.8% Fibonacci retracement level of $588.
La mecha larga de la vela de BNB (BNB) del 25 y 26 de marzo muestra que los bajistas están defendiendo el nivel de retroceso de Fibonacci del 61,8% de 588 dólares.

If the price turns down from the current level, the BNB/USDT pair could reach the 20-day EMA ($546). This remains the critical level to keep an eye on. If the price rebounds off the 20-day EMA, the pair will again attempt to rise above $600 and reach $645.
Si el precio baja del nivel actual, el par BNB/USDT podría alcanzar la EMA de 20 días ($546). Este sigue siendo el nivel crítico al que hay que prestar atención. Si el precio rebota en la EMA de 20 días, el par intentará nuevamente subir por encima de los $600 y alcanzar los $645.
On the other hand, if the price drops below the 20-day EMA, it will signal that the bears are trying to gain the upper hand. The pair could then drop to the critical support at $495. The bulls may aggressively buy the dips to this level.
Por otro lado, si el precio cae por debajo de la EMA de 20 días, indicará que los bajistas están tratando de tomar ventaja. Luego, el par podría caer hasta el soporte crítico de 495 dólares. Los alcistas pueden comprar agresivamente en las caídas hasta este nivel.
Solana price analysis
Análisis de precios de Solana
Solana’s (SOL) recovery is faltering at $196, indicating that the bears are selling on relief rallies near the overhead resistance of $205.
La recuperación de Solana (SOL) está flaqueando en 196 dólares, lo que indica que los bajistas están vendiendo en repuntes de alivio cerca de la resistencia superior de 205 dólares.
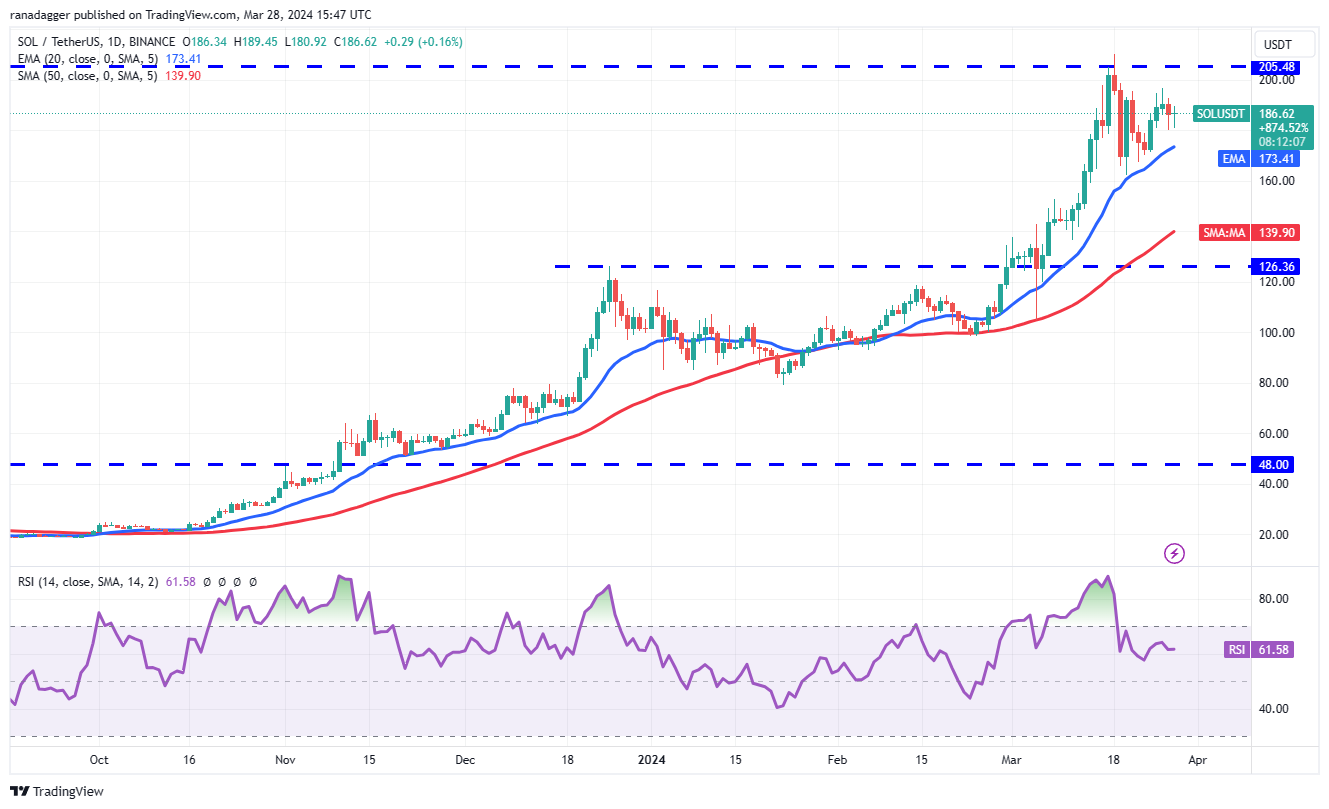
The bears will try to pull the price to the 20-day EMA ($173), which is a crucial level to keep an eye on. If the price plunges below the 20-day EMA, it will suggest the bears are in the driver’s seat. The SOL/USDT pair could decline to $162 and below that to the 50-day SMA ($140).
Los bajistas intentarán llevar el precio a la EMA de 20 días ($173), que es un nivel crucial al que hay que prestar atención. Si el precio cae por debajo de la EMA de 20 días, sugerirá que los bajistas están al mando. El par SOL/USDT podría caer a $162 y por debajo de eso a la SMA de 50 días ($140).
Instead, if the price turns up from the current level or rebounds off the 20-day EMA, it will indicate solid demand at lower levels. That will enhance the prospects of a break above $205. If that happens, the pair may start its journey to $267.
En cambio, si el precio sube desde el nivel actual o rebota en la EMA de 20 días, indicará una demanda sólida en niveles más bajos. Eso mejorará las perspectivas de una ruptura por encima de los 205 dólares. Si eso sucede, el par puede comenzar su viaje a 267 dólares.
XRP price analysis
Análisis de precios XRP
XRP (XRP) has been stuck between the uptrend line and $0.67 for the past few days, indicating indecision among the buyers and sellers.
XRP (XRP) ha estado atrapado entre la línea de tendencia alcista y $0,67 durante los últimos días, lo que indica indecisión entre compradores y vendedores.
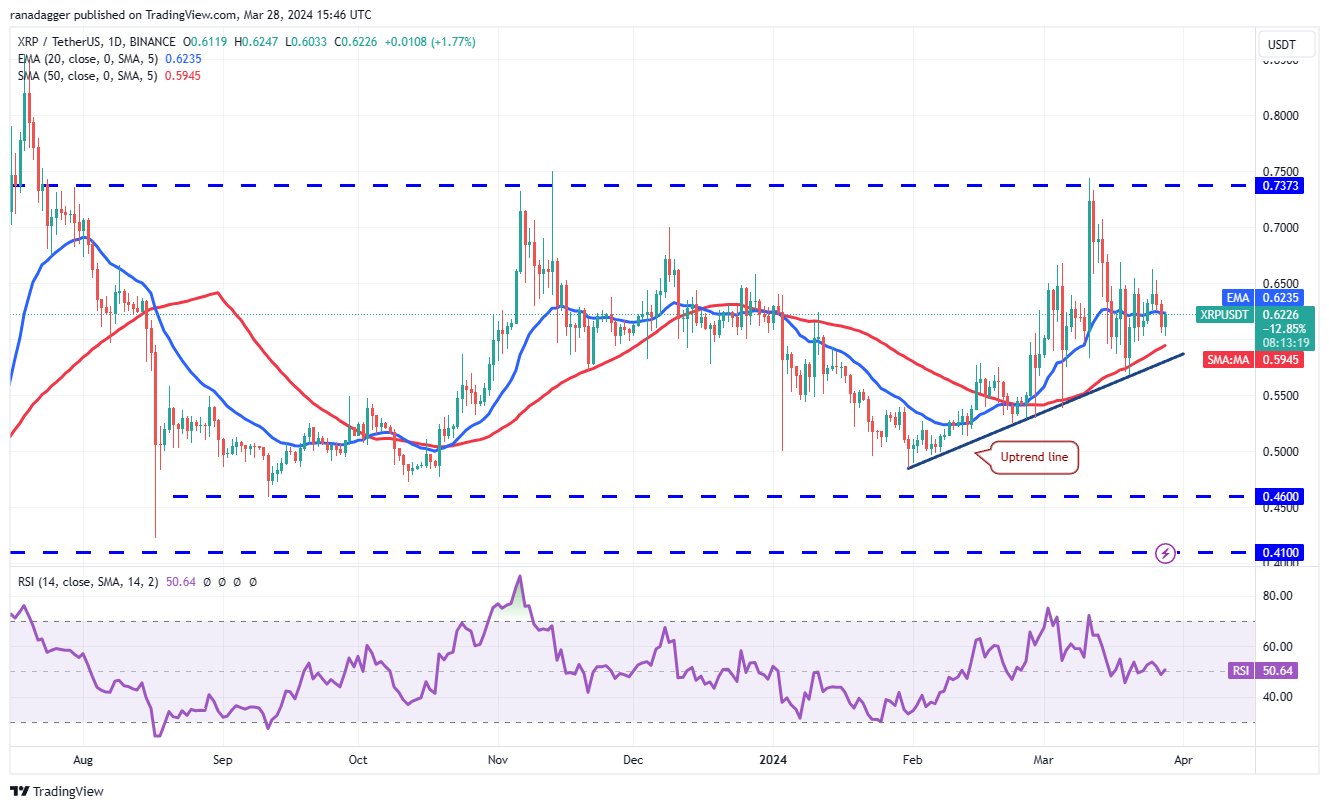
If the price maintains below the 20-day EMA ($0.62), the XRP/USDT pair could drop to the uptrend line. A strong rebound off this level will suggest that the range-bound action may continue for a few more days.
Si el precio se mantiene por debajo de la EMA de 20 días ($0,62), el par XRP/USDT podría caer a la línea de tendencia alcista. Un fuerte rebote desde este nivel sugerirá que la acción dentro del rango puede continuar durante unos días más.
The next trending move is likely to begin on a break above $0.67 or on a drop below the uptrend line. Above $0.67, the pair could start a rally to the formidable hurdle at $0.74. On the downside, a break below the uptrend line could sink the pair to $0.52.
Es probable que el próximo movimiento de tendencia comience con una ruptura por encima de USD 0,67 o con una caída por debajo de la línea de tendencia alcista. Por encima de USD 0,67, el par podría iniciar un repunte hasta el formidable obstáculo de USD 0,74. En el lado negativo, una ruptura por debajo de la línea de tendencia alcista podría hundir el par a 0,52 dólares.
Cardano price analysis
Análisis de precios de Cardano
The long wick on Cardano’s (ADA) March 26 candlestick suggests that the bears are trying to keep the price below $0.68.
La mecha larga de la vela de Cardano (ADA) del 26 de marzo sugiere que los bajistas están tratando de mantener el precio por debajo de 0,68 dólares.
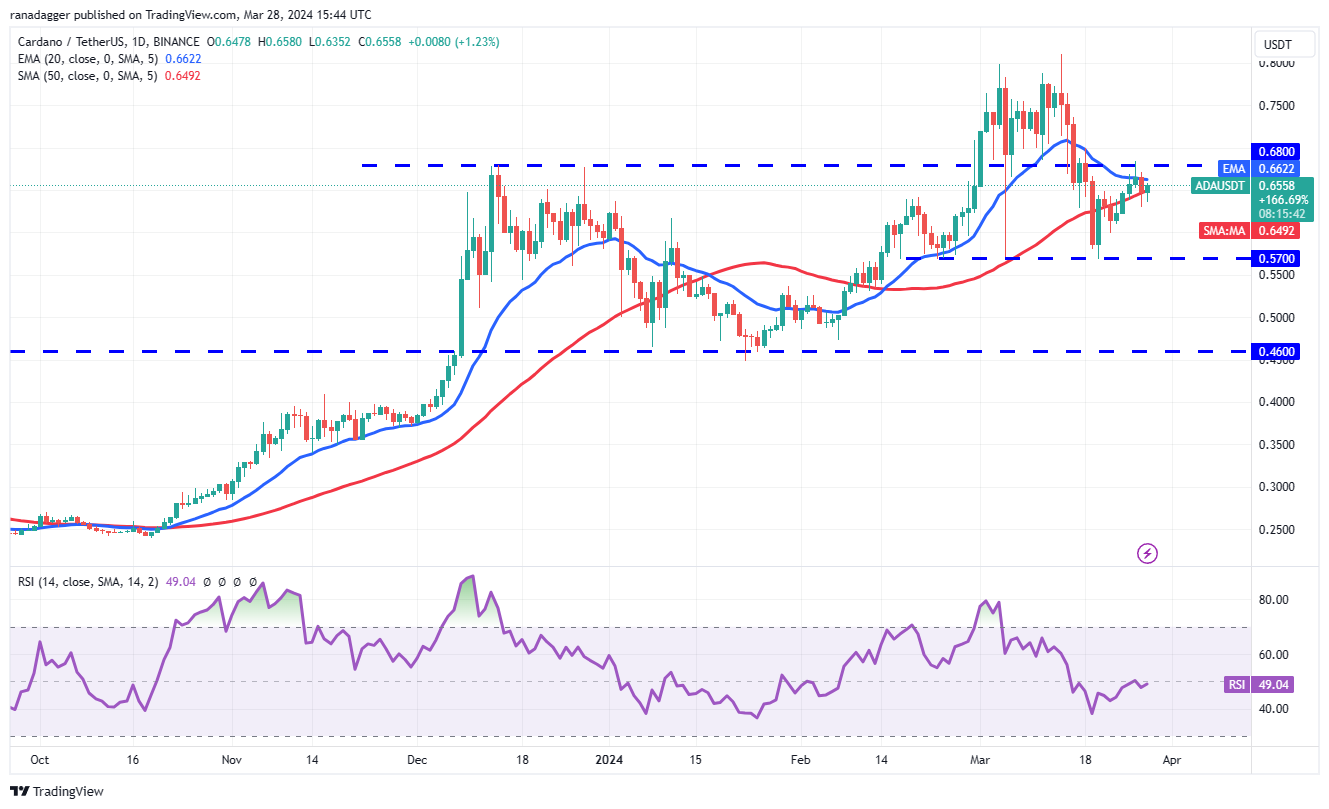
If the price remains below the moving averages, it will signal that the ADA/USDT pair could swing between $0.57 and $0.68 for a while. The flattening 20-day EMA ($0.66) and the RSI near the midpoint suggest a consolidation in the near term.
Si el precio se mantiene por debajo de los promedios móviles, indicará que el par ADA/USDT podría oscilar entre $0,57 y $0,68 por un tiempo. El aplanamiento de la EMA de 20 días ($0,66) y el RSI cerca del punto medio sugieren una consolidación en el corto plazo.
However, if the price turns up from the current level and breaks above $0.70, it will indicate that the bulls are back in the game. The pair may then attempt a rally to $0.81, where the bears may pose a strong challenge.
Sin embargo, si el precio sube desde el nivel actual y supera los 0,70 dólares, indicará que los alcistas han vuelto al juego. Luego, el par podría intentar subir hasta USD 0,81, donde los bajistas podrían representar un gran desafío.
Dogecoin price analysis
Análisis de precios de Dogecoin
Dogecoin (DOGE) soared above the $0.19 to $0.21 overhead resistance zone on March 28, indicating aggressive buying by the bulls.
Dogecoin (DOGE) se disparó por encima de la zona de resistencia superior de 0,19 a 0,21 dólares el 28 de marzo, lo que indica compras agresivas por parte de los alcistas.
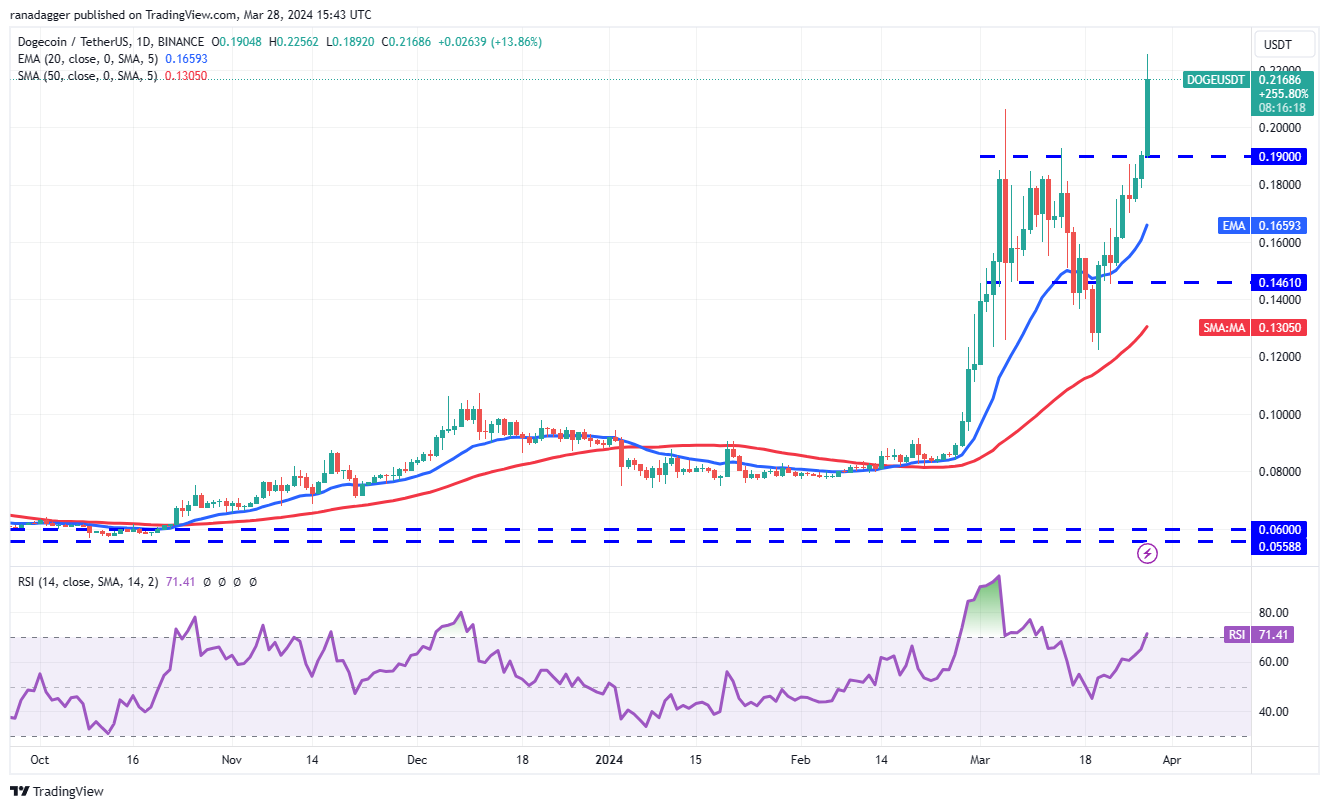
The upsloping moving averages and the RSI in the overbought zone suggest that bulls are in command. There is a minor resistance at $0.23, but if buyers bulldoze their way through, the DOGE/USDT pair could rally to $0.30 and then to $0.35.
Los promedios móviles ascendentes y el RSI en la zona de sobrecompra sugieren que los alcistas tienen el mando. Hay una resistencia menor en 0,23$, pero si los compradores se abren paso, el par DOGE/USDT podría subir a 0,30$ y luego a 0,35$.
If bears want to prevent the upside, they will have to quickly pull the price back below $0.19. If they do that, it will trap the aggressive bulls, resulting in long liquidation. The pair could then slump to the 20-day EMA ($0.16).
Si los bajistas quieren evitar la subida, tendrán que bajar rápidamente el precio por debajo de 0,19 dólares. Si lo hacen, atraparán a los alcistas agresivos, lo que resultará en una liquidación larga. Luego, el par podría caer hasta la EMA de 20 días (USD 0,16).
Related: Bitcoin whales copy classic bull market moves as BTC price eyes $72K
Relacionado: Las ballenas Bitcoin copian los movimientos clásicos del mercado alcista mientras el precio de BTC apunta a $72K
Avalanche price analysis
Análisis de precios de avalancha
Avalanche’s (AVAX) price action of the past few days has formed a pennant, indicating indecision between the bulls and the bears.
La acción del precio de Avalanche (AVAX) de los últimos días ha formado un banderín, lo que indica indecisión entre los alcistas y los bajistas.
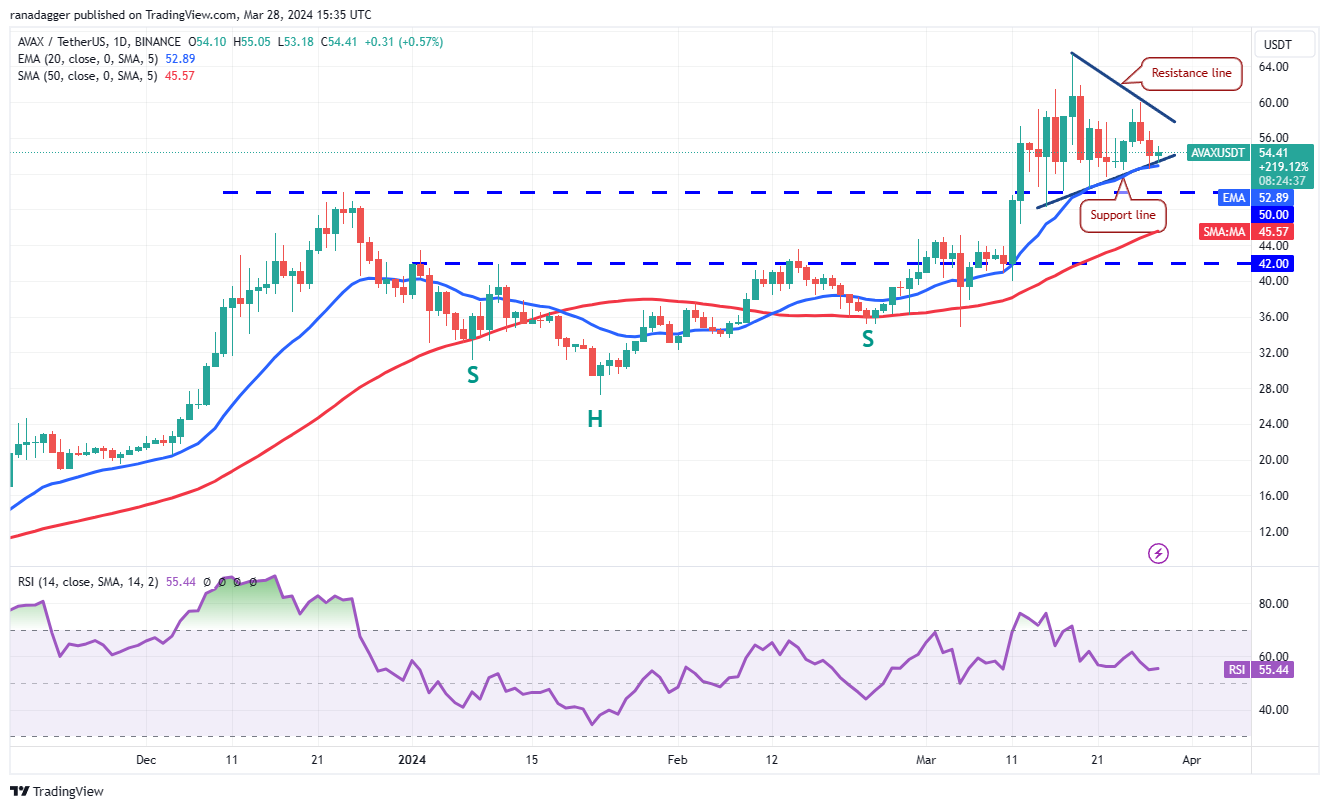
The upsloping 20-day EMA ($52) and the RSI in the positive territory indicate a slight advantage to buyers.
La EMA de 20 días ($ 52) alcista y el RSI en territorio positivo indican una ligera ventaja para los compradores.
The bulls will try to defend the support line of the pennant and push the price toward the resistance line. A break and close above the pennant will signal that the AVAX/USDT pair could resume the uptrend. The pair may rise to $65 and later to the pattern target of $76.
Los alcistas intentarán defender la línea de soporte del banderín y empujar el precio hacia la línea de resistencia. Una ruptura y un cierre por encima del banderín indicarán que el par AVAX/USDT podría reanudar la tendencia alcista. El par puede subir a $65 y luego al objetivo del patrón de $76.
Alternatively, if the price breaks below the pennant, it will suggest that the bears have overpowered the bulls. There is strong support at $50, but if this level gives way, the pair could tumble to the 50-day SMA ($45).
Alternativamente, si el precio cae por debajo del banderín, sugerirá que los bajistas han dominado a los alcistas. Hay un fuerte soporte en $50, pero si este nivel cede, el par podría caer a la SMA de 50 días ($45).
Shiba Inu price analysis
Análisis de precios de Shiba Inu
Shiba Inu’s (SHIB) recovery climbed above the resistance line on March 26, indicating that the selling pressure is reducing.
La recuperación de Shiba Inu (SHIB) superó la línea de resistencia el 26 de marzo, lo que indica que la presión de venta se está reduciendo.
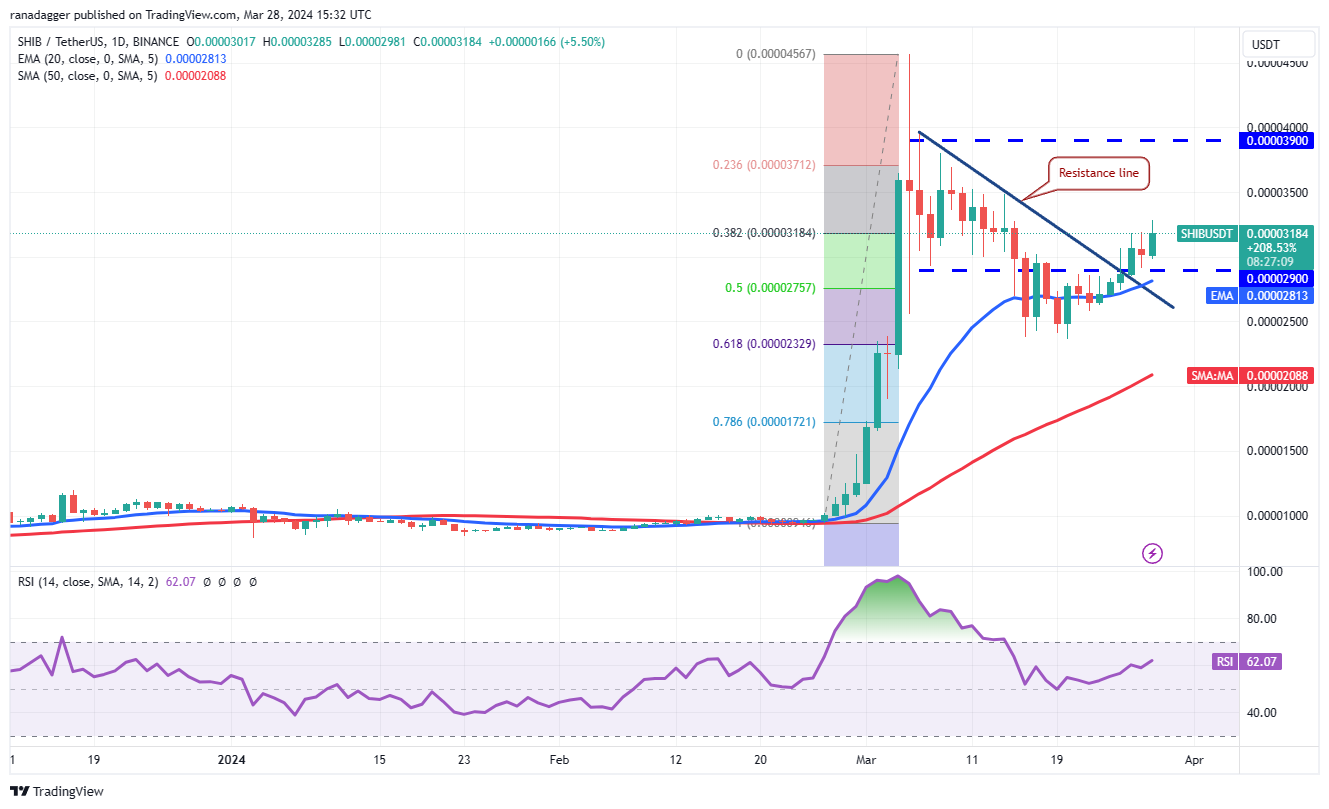
The SHIB/USDT pair is likely to rise to $0.000035 where the bears are again expected to mount a strong defense. A break above this level could open the doors for a possible rise to $0.000039.
Es probable que el par SHIB/USDT suba a USD 0,000035, donde se espera que los bajistas vuelvan a montar una fuerte defensa. Una ruptura por encima de este nivel podría abrir las puertas a un posible aumento a USD 0,000039.
This positive view will be invalidated in the near term if the price turns down and breaks below the 20-day EMA ($0.000028). If that happens, it will suggest that the break above the resistance line may have been a bull trap. The pair may drop to the 50-day SMA ($0.000021).
Esta visión positiva quedará invalidada en el corto plazo si el precio baja y cae por debajo de la EMA de 20 días ($0,000028). Si eso sucede, sugerirá que la ruptura por encima de la línea de resistencia puede haber sido una trampa alcista. El par puede caer hasta la SMA de 50 días ($0,000021).
Toncoin price analysis
Análisis de precios de Toncoin
Toncoin (TON) is correcting in an uptrend, but the pullback is finding support at the 38.2% Fibonacci retracement level of $4.78, signaling buying on dips.
Toncoin (TON) se está corrigiendo en una tendencia alcista, pero el retroceso está encontrando soporte en el nivel de retroceso de Fibonacci del 38,2% de 4,78 dólares, lo que indica compras en las caídas.
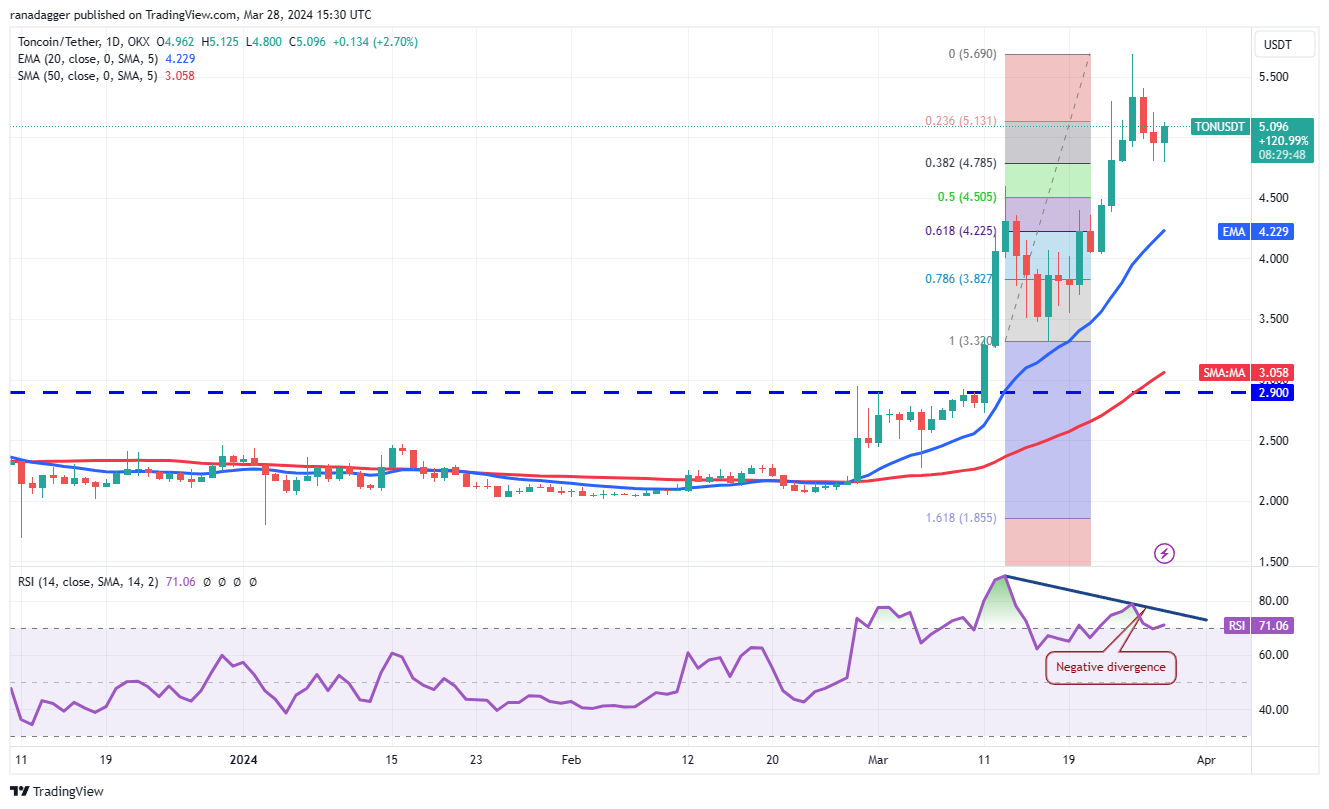
The upsloping moving averages suggest an advantage to the bulls, but the developing negative divergence on the RSI points to a possible consolidation or correction in the short term. If the price turns down and slips below $4.78, it will indicate selling on rallies. The TON/USDT pair could sink to the 20-day EMA ($4.22).
Los promedios móviles ascendentes sugieren una ventaja para los alcistas, pero la divergencia negativa en desarrollo en el RSI apunta a una posible consolidación o corrección en el corto plazo. Si el precio baja y cae por debajo de 4,78 dólares, indicará venta en los repuntes. El par TON/USDT podría hundirse hasta la EMA de 20 días ($4,22).
Contrarily, if the rebound sustains, the rally could reach the stiff overhead resistance of $5.69. A break above this level will signal the start of the next leg of the uptrend toward $7.15.
Por el contrario, si el rebote se mantiene, el repunte podría alcanzar la rígida resistencia superior de 5,69 dólares. Una ruptura por encima de este nivel señalará el inicio del siguiente tramo de la tendencia alcista hacia 7,15 dólares.
This article does not contain investment advice or recommendations. Every investment and trading move involves risk, and readers should conduct their own research when making a decision.
Este artículo no contiene consejos ni recomendaciones de inversión. Cada movimiento de inversión y comercio implica riesgos, y los lectores deben realizar su propia investigación al tomar una decisión.
 Crypto Daily™
 CaptainAltcoin
 Thecryptoupdates
 Crypto Intelligence
 CoinsProbe
 Crypto News Land
 DogeHome
 InsideBitcoin News
 Coin Edition


