

Bitcoin’s (BTC) recent fall does not seem to have dented the demand for the spot Bitcoin exchange-traded funds. After five days of successive net outflows last week, demand bounced back sharply with $418 million in net inflows into the ETFs on March 26 and $243 million inflows on March 27, according to Farside Investors data.
ビットコイン(BTC)の最近の下落は、スポットビットコイン上場投資信託(ETF)への需要を低下させていないようだ。ファーサイド・インベスターズのデータによると、先週は5日連続の純流出の後、需要は急激に回復し、3月26日にはETFに4億1,800万ドルの純流入があり、3月27日には2億4,300万ドルの流入があった。
BlackRock CEO Larry Fink said in an interview with Fox Business that he was “pleasantly surprised” with the performance of the firm’s spot Bitcoin ETF, which was the “fastest growing ETF in the history of ETFs.” Fink added that he was “very bullish on the long-term viability of Bitcoin.”
ブラックロックのラリー・フィンク最高経営責任者(CEO)はフォックス・ビジネスとのインタビューで、「ETF史上最も急成長している」同社のビットコインスポットETFのパフォーマンスに「嬉しい驚き」を示した。フィンク氏は「ビットコインの長期的な存続可能性については非常に強気だ」と付け加えた。
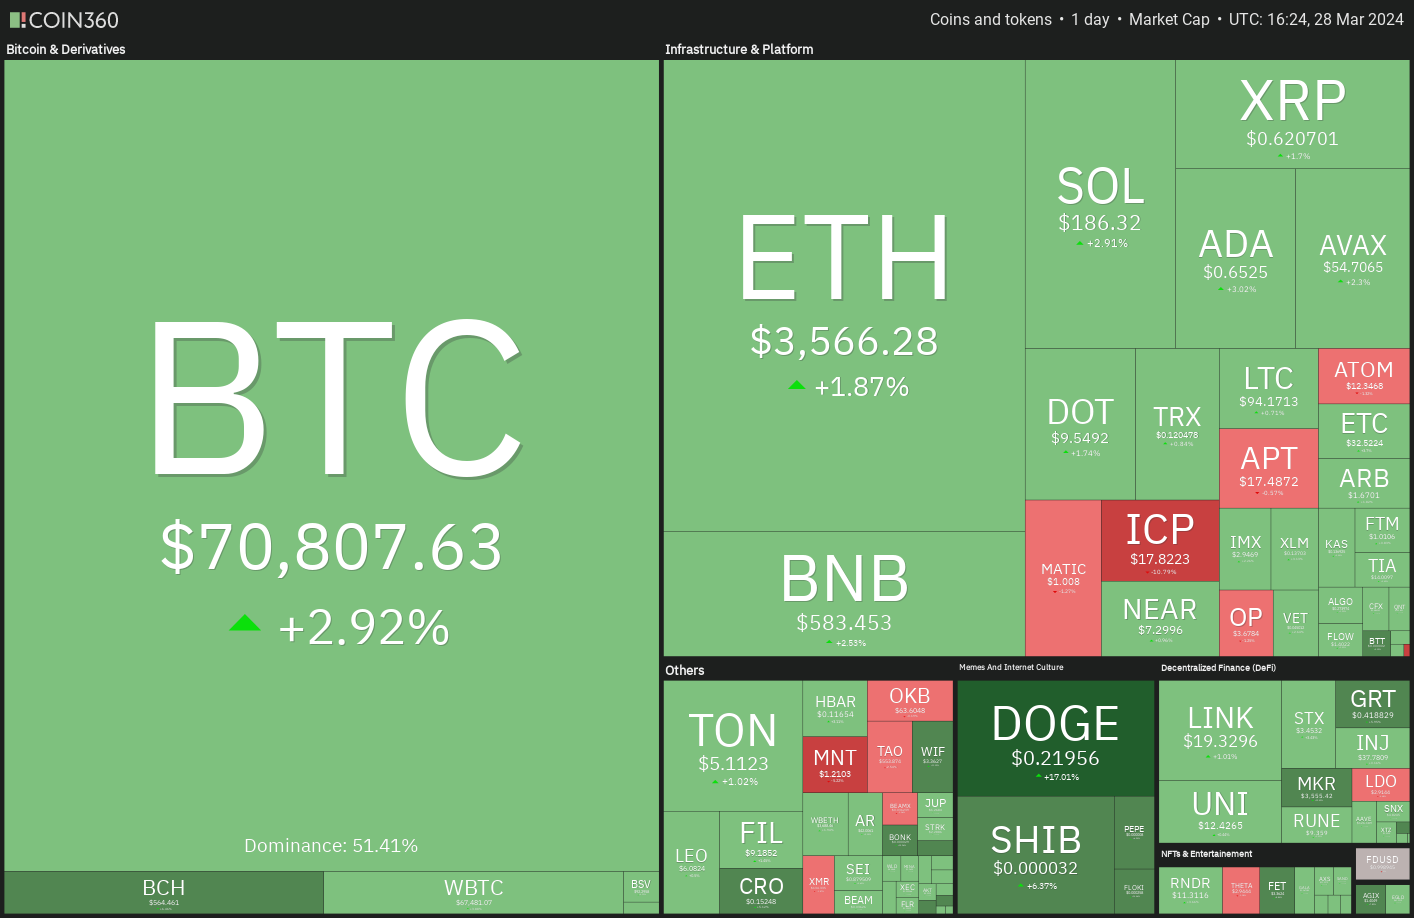
On-chain analytics platform CryptoQuant said in its latest “Weekly Crypto Report” that Bitcoin’s demand skyrocketed from “40K Bitcoin at the start of 2024 to 213K Bitcoin” on March 26. That could create a “sell-side liquidity crisis” within the next year.
オンチェーン分析プラットフォームのクリプトクアントは、最新の「週刊暗号レポート」で、ビットコインの需要が「2024年初めの4万ビットコインから3月26日には21万3千ビットコイン」に急増したと述べた。これにより、来年中に「セルサイドの流動性危機」が生じる可能性があると述べた。年。
Could Bitcoin continue its recovery and hit a new all-time high before the Bitcoin halving? Will that trigger buying in altcoins? Let’s analyze the charts of the top 10 cryptocurrencies to find out.
ビットコインは回復を続け、ビットコイン半減期の前に最高値を更新する可能性があるだろうか?それはアルトコインの購入を引き起こすでしょうか?それを知るために、トップ 10 の仮想通貨のチャートを分析してみましょう。
Bitcoin price analysis
ビットコイン価格分析
Bitcoin witnessed profit booking on March 26 and 27, but a positive sign is that the bulls maintained the price above the pennant.
ビットコインは3月26日と27日に利益確定が見られたが、強気派がペナントを上回る価格を維持したことは明るい兆しだ。
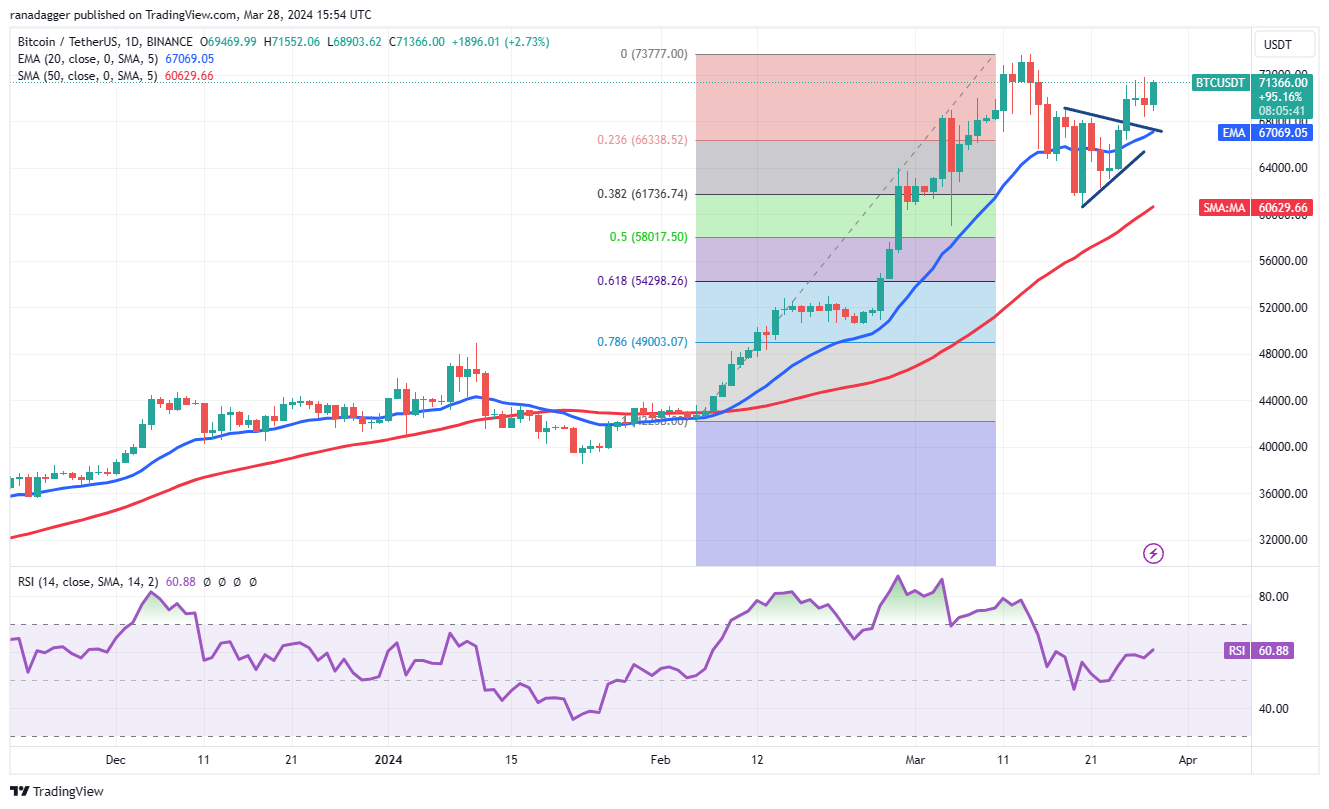
The 20-day exponential moving average (EMA) ($67,069) has started to turn up, and the relative strength index (RSI) is in the positive territory, suggesting that the path of least resistance is to the upside.
20 日指数移動平均 (EMA) (67,069 ドル) は上昇に転じ始め、相対力指数 (RSI) はプラス領域にあり、最も抵抗が少ない道は上値に向かうことを示唆しています。
If buyers drive the price above $73,777, the BTC/USDT pair is likely to pick up momentum and rally to $80,000.
買い手が価格を73,777ドル以上に押し上げれば、BTC/USDTペアは勢いを増し、80,000ドルまで上昇する可能性が高い。
On the contrary, if the price turns down from the current level and breaks below the 20-day EMA, it could open the doors for a potential drop to the 50-day simple moving average ($60,629).
逆に、価格が現在のレベルから下落し、20日EMAを下回った場合、50日単純移動平均(60,629ドル)まで下落する可能性があります。
Ether price analysis
イーサ価格分析
Ether (ETH) is facing selling near $3,678, but a positive sign is that the bulls are trying to defend the 20-day EMA ($3,530).
イーサ(ETH)は3,678ドル付近での売りに直面しているが、強気派が20日間EMA(3,530ドル)を守ろうとしていることは明るい兆しだ。
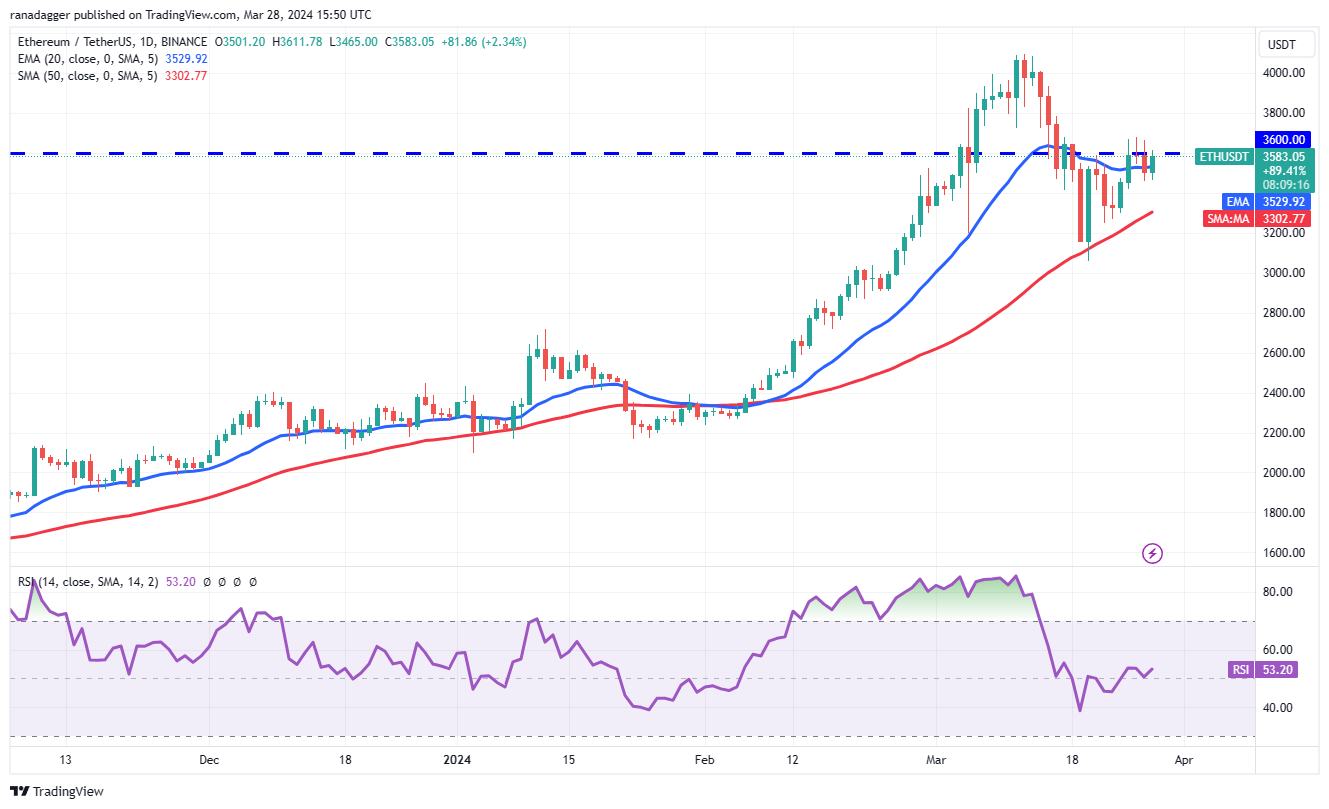
If the price breaks above $3,678, the possibility of a rally to $4,100 increases. This level may act as a stiff hurdle, but if the buyers prevail, the ETH/USDT pair could rally to $4,500 and then to $4,868.
価格が3,678ドルを突破すれば、4,100ドルまで上昇する可能性が高まる。この水準は厳しいハードルとなるかもしれないが、買い手が優勢であれば、ETH/USDTペアは4,500ドル、そして4,868ドルまで上昇する可能性がある。
Conversely, if the price turns down sharply and breaks below $3,460, it will suggest that the bears are not willing to give up. The pair may then slip to the 50-day SMA ($3,302). A slide below this support could start a deeper correction.
逆に、価格が急激に下落して3,460ドルを下回った場合は、弱気派が諦めるつもりがないことを示唆することになる。その後、このペアは50日SMA(3,302ドル)に下落する可能性がある。このサポートを下回るスライドは、より深い調整を開始する可能性があります。
BNB price analysis
BNB価格分析
The long wick on BNB’s (BNB) March 25 and 26 candlestick shows that the bears are defending the 61.8% Fibonacci retracement level of $588.
BNB(BNB)の3月25日と26日のローソク足の長い芯は、弱気派が61.8%のフィボナッチ・リトレースメントのレベルである588ドルを守っていることを示している。

If the price turns down from the current level, the BNB/USDT pair could reach the 20-day EMA ($546). This remains the critical level to keep an eye on. If the price rebounds off the 20-day EMA, the pair will again attempt to rise above $600 and reach $645.
価格が現在のレベルから下落すれば、BNB/USDTペアは20日間EMA(546ドル)に達する可能性がある。これは引き続き注目すべき重要なレベルです。価格が20日間EMAから反発した場合、ペアは再び600ドルを超えて645ドルに達することを試みるでしょう。
On the other hand, if the price drops below the 20-day EMA, it will signal that the bears are trying to gain the upper hand. The pair could then drop to the critical support at $495. The bulls may aggressively buy the dips to this level.
一方で、価格が20日間EMAを下回った場合は、弱気派が優位に立とうとしていることを示すことになる。その後、ペアは重要なサポートである495ドルまで下落する可能性がある。強気派はこのレベルまでの押し目を積極的に買うかもしれない。
Solana price analysis
ソラナの価格分析
Solana’s (SOL) recovery is faltering at $196, indicating that the bears are selling on relief rallies near the overhead resistance of $205.
ソラナ(SOL)の回復は196ドルで低迷しており、弱気派が頭上の抵抗線である205ドル付近の救済反発で売りを出していることを示している。
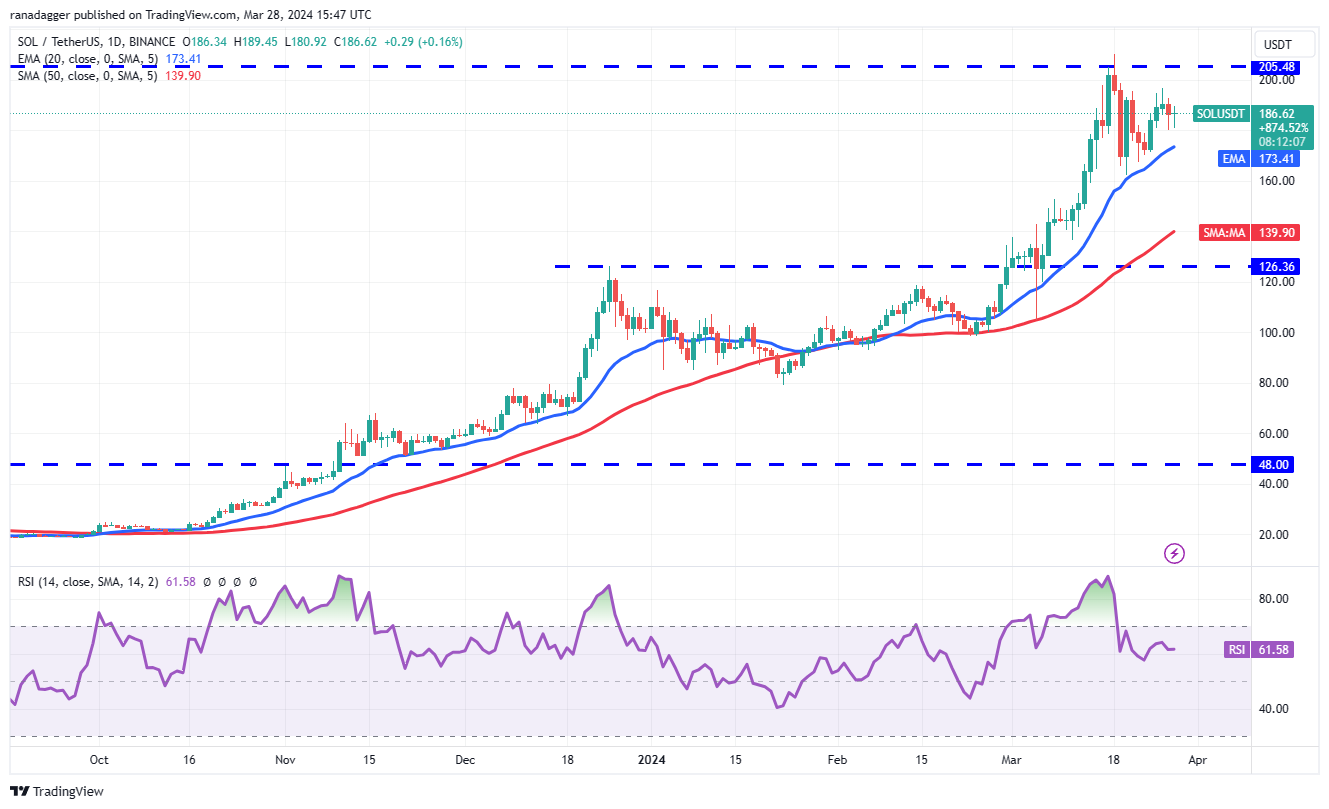
The bears will try to pull the price to the 20-day EMA ($173), which is a crucial level to keep an eye on. If the price plunges below the 20-day EMA, it will suggest the bears are in the driver’s seat. The SOL/USDT pair could decline to $162 and below that to the 50-day SMA ($140).
弱気派は価格を20日間EMA(173ドル)まで引き下げようとするが、これは注目すべき重要なレベルである。価格が20日間EMAを下回った場合、弱気派が主導権を握っていることが示唆されるだろう。 SOL/USDTペアは162ドルまで下落し、それを下回って50日SMA(140ドル)まで下落する可能性がある。
Instead, if the price turns up from the current level or rebounds off the 20-day EMA, it will indicate solid demand at lower levels. That will enhance the prospects of a break above $205. If that happens, the pair may start its journey to $267.
むしろ、価格が現在のレベルから上昇するか、20日間EMAから反発する場合、それはより低いレベルでの堅調な需要を示すことになります。これにより、205ドルを突破する可能性が高まるだろう。そうなれば、ペアは267ドルへの旅を始める可能性がある。
XRP price analysis
XRP価格分析
XRP (XRP) has been stuck between the uptrend line and $0.67 for the past few days, indicating indecision among the buyers and sellers.
XRP(XRP)はここ数日間、上昇トレンドラインと0.67ドルの間でスタックしており、買い手と売り手の優柔不断さを示している。
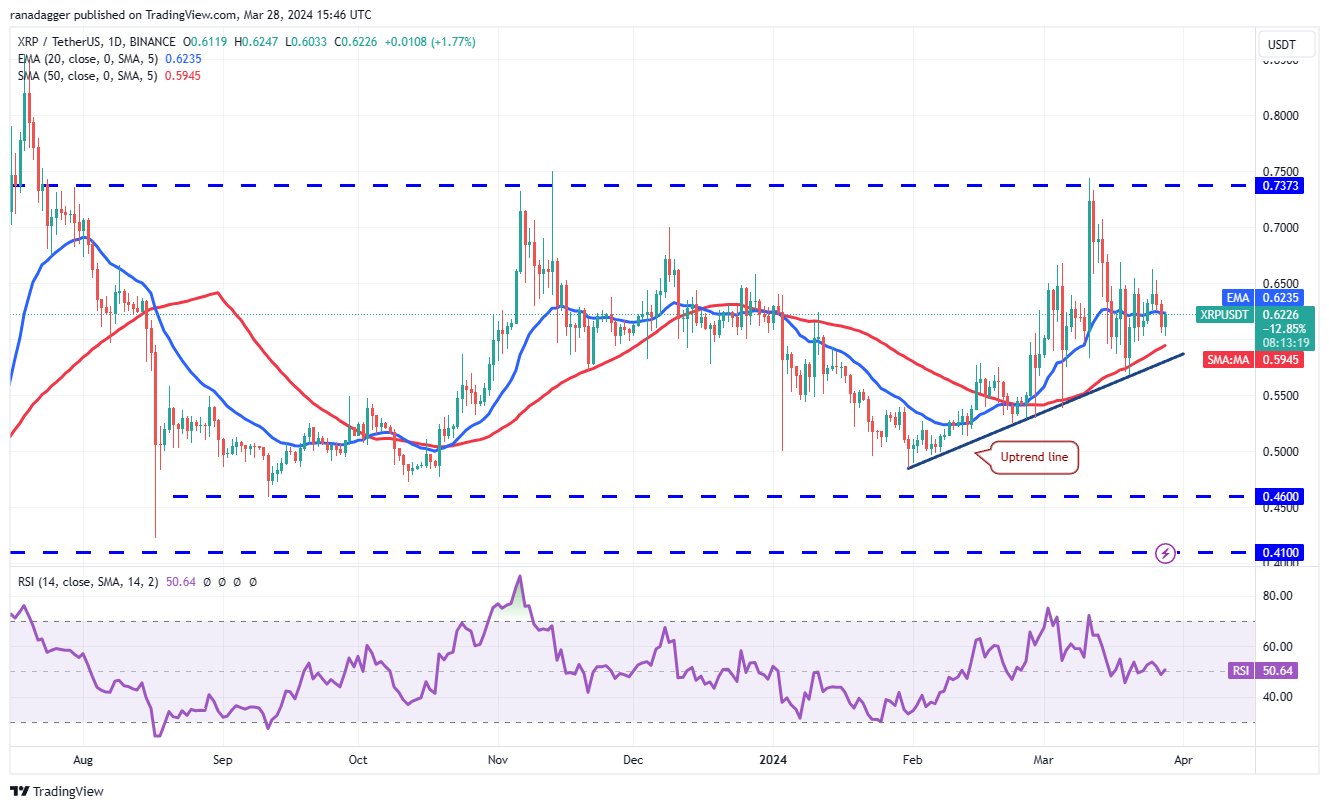
If the price maintains below the 20-day EMA ($0.62), the XRP/USDT pair could drop to the uptrend line. A strong rebound off this level will suggest that the range-bound action may continue for a few more days.
価格が20日間EMA(0.62ドル)を下回った場合、XRP/USDTペアは上昇トレンドラインまで下落する可能性がある。この水準からの強い反発は、レンジ内での動きがさらに数日間続く可能性を示唆するだろう。
The next trending move is likely to begin on a break above $0.67 or on a drop below the uptrend line. Above $0.67, the pair could start a rally to the formidable hurdle at $0.74. On the downside, a break below the uptrend line could sink the pair to $0.52.
次のトレンドの動きは、0.67ドルを超えるか、上昇トレンドラインを下回る下落で始まる可能性が高い。 0.67ドルを超えると、0.74ドルという恐ろしいハードルに向けて上昇を始める可能性がある。下値としては、上昇トレンドラインを下抜けた場合、ペアは0.52ドルまで下落する可能性がある。
Cardano price analysis
カルダノの価格分析
The long wick on Cardano’s (ADA) March 26 candlestick suggests that the bears are trying to keep the price below $0.68.
カルダノ(ADA)の3月26日のローソク足の長い芯は、弱気派が価格を0.68ドル以下に抑えようとしていることを示唆している。
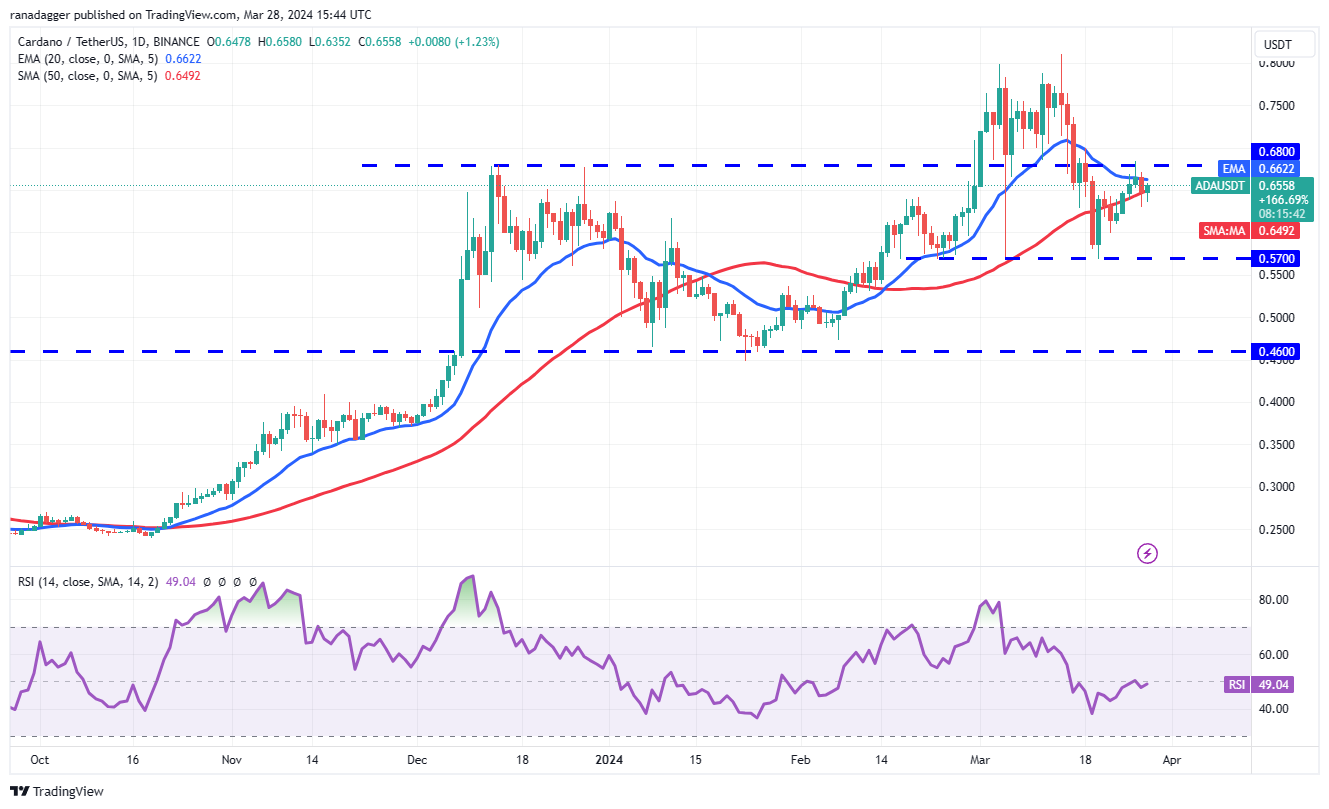
If the price remains below the moving averages, it will signal that the ADA/USDT pair could swing between $0.57 and $0.68 for a while. The flattening 20-day EMA ($0.66) and the RSI near the midpoint suggest a consolidation in the near term.
価格が移動平均を下回ったままであれば、ADA/USDTペアがしばらくの間0.57ドルから0.68ドルの間で変動する可能性があることを示唆するでしょう。横ばいの20日間EMA(0.66ドル)と中間点付近のRSIは、短期的な値固めを示唆している。
However, if the price turns up from the current level and breaks above $0.70, it will indicate that the bulls are back in the game. The pair may then attempt a rally to $0.81, where the bears may pose a strong challenge.
しかし、価格が現在の水準から上昇し、0.70ドルを突破すれば、強気派がゲームに戻ってきたことを示すことになる。その後、ペアは0.81ドルへの上昇を試みる可能性があり、弱気派が強い挑戦となる可能性がある。
Dogecoin price analysis
ドージコインの価格分析
Dogecoin (DOGE) soared above the $0.19 to $0.21 overhead resistance zone on March 28, indicating aggressive buying by the bulls.
ドージコイン(DOGE)は3月28日に0.19ドルから0.21ドルの直上抵抗ゾーンを超えて急騰し、強気派の積極的な買いを示した。
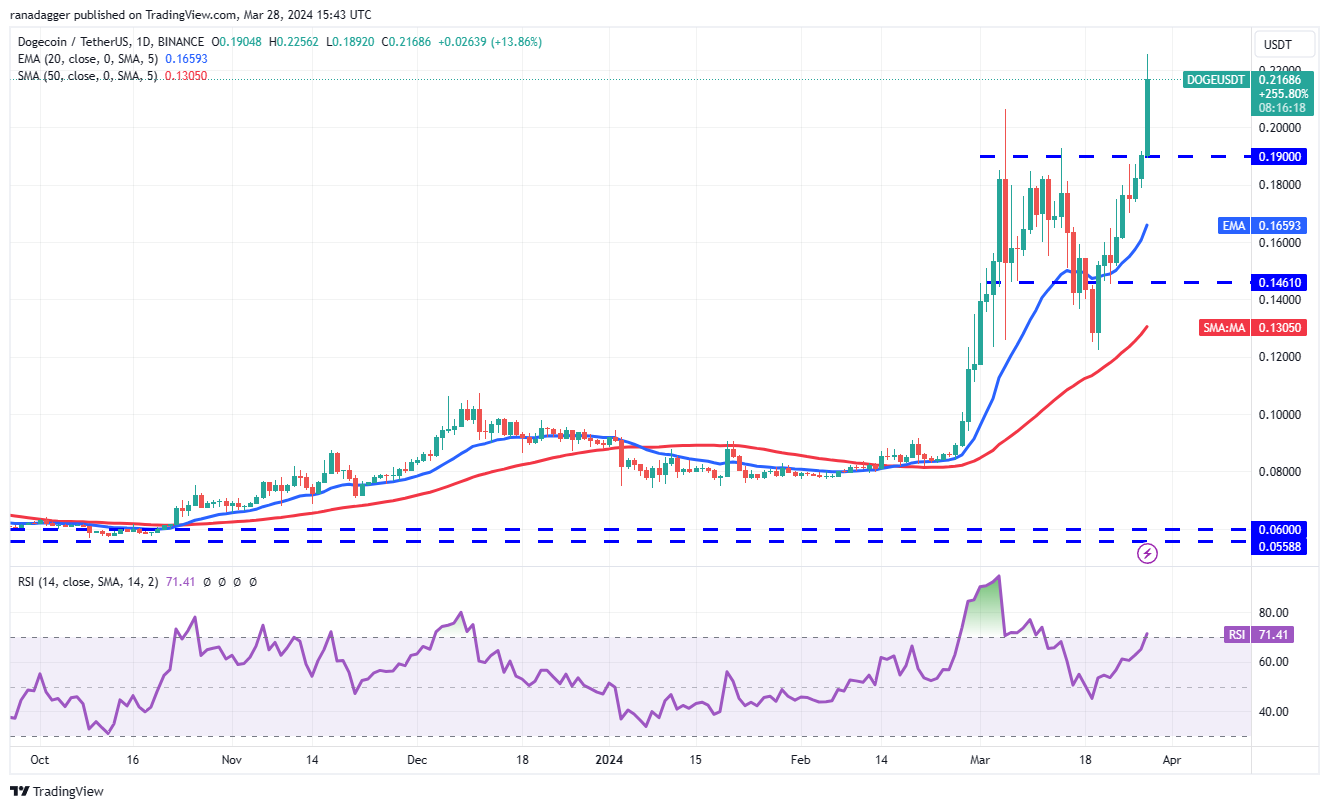
The upsloping moving averages and the RSI in the overbought zone suggest that bulls are in command. There is a minor resistance at $0.23, but if buyers bulldoze their way through, the DOGE/USDT pair could rally to $0.30 and then to $0.35.
移動平均線の上昇と買われ過ぎゾーンのRSIは、強気派が主導権を握っていることを示唆している。 0.23ドルに若干の抵抗があるが、買い手が強気で突破すれば、DOGE/USDTペアは0.30ドル、そして0.35ドルまで上昇する可能性がある。
If bears want to prevent the upside, they will have to quickly pull the price back below $0.19. If they do that, it will trap the aggressive bulls, resulting in long liquidation. The pair could then slump to the 20-day EMA ($0.16).
弱気派が上昇を阻止したい場合は、価格を速やかに0.19ドル以下に引き下げる必要があるだろう。そうすれば、攻撃的な強気派を罠にはめて、清算が長引くことになる。その後、ペアは20日間EMA(0.16ドル)まで下落する可能性がある。
Related: Bitcoin whales copy classic bull market moves as BTC price eyes $72K
関連:BTC価格が7万2千ドルを目指すなか、ビットコインクジラは古典的な強気市場の動きを真似る
Avalanche price analysis
雪崩価格分析
Avalanche’s (AVAX) price action of the past few days has formed a pennant, indicating indecision between the bulls and the bears.
過去数日間のアバランチ(AVAX)の価格動向はペナントを形成しており、強気派と弱気派の間で優柔不断な姿勢が見られることを示しています。
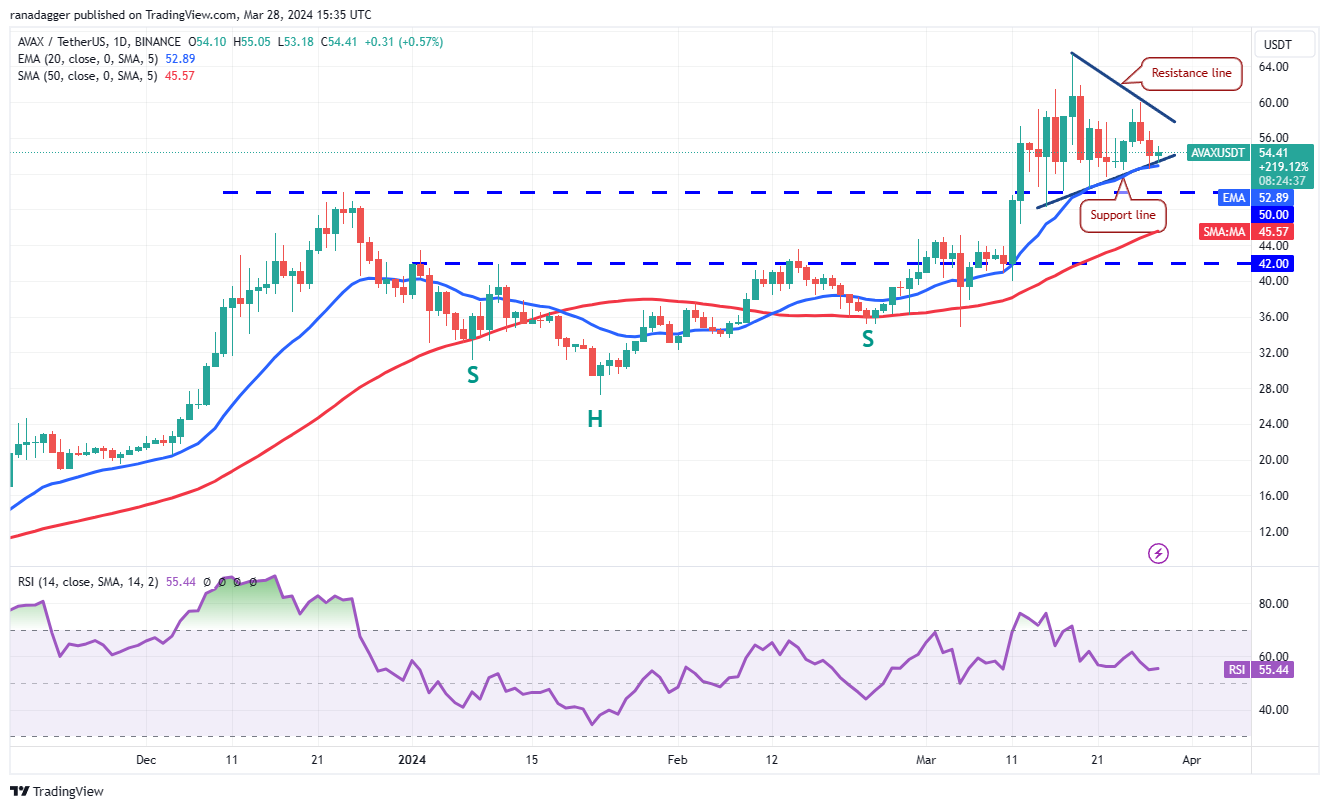
The upsloping 20-day EMA ($52) and the RSI in the positive territory indicate a slight advantage to buyers.
20 日間 EMA (52 ドル) が右肩上がりで、RSI がプラス領域にあることは、買い手が若干有利であることを示しています。
The bulls will try to defend the support line of the pennant and push the price toward the resistance line. A break and close above the pennant will signal that the AVAX/USDT pair could resume the uptrend. The pair may rise to $65 and later to the pattern target of $76.
強気派はペナントのサポートラインを守り、価格をレジスタンスラインに向けて押し上げようとします。ペナントを上抜けて引ければ、AVAX/USDTペアが上昇トレンドを再開する可能性があることを示します。ペアは65ドルまで上昇し、その後はパターン目標の76ドルまで上昇する可能性がある。
Alternatively, if the price breaks below the pennant, it will suggest that the bears have overpowered the bulls. There is strong support at $50, but if this level gives way, the pair could tumble to the 50-day SMA ($45).
あるいは、価格がペナントを下回った場合、弱気派が強気派を圧倒したことを示唆するでしょう。 50ドルには強力なサポートがあるが、このレベルが崩れた場合、ペアは50日間SMA(45ドル)まで下落する可能性がある。
Shiba Inu price analysis
柴犬の価格分析
Shiba Inu’s (SHIB) recovery climbed above the resistance line on March 26, indicating that the selling pressure is reducing.
柴犬(SHIB)の回復は3月26日の抵抗線を上回り、売り圧力が低下していることを示している。
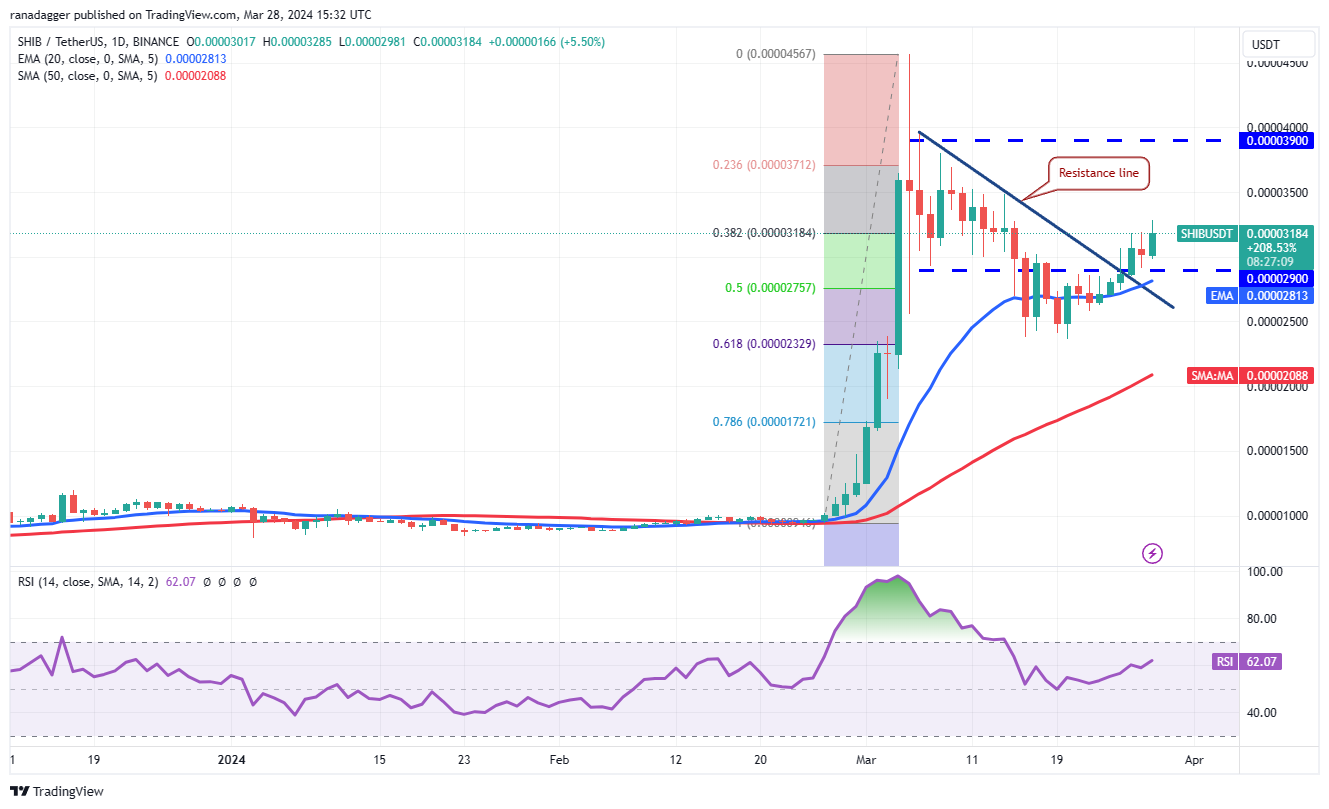
The SHIB/USDT pair is likely to rise to $0.000035 where the bears are again expected to mount a strong defense. A break above this level could open the doors for a possible rise to $0.000039.
SHIB/USDTペアは0.000035ドルまで上昇する可能性が高く、弱気派は再び強力な防御を開始すると予想される。このレベルを超えると、0.000039ドルまで上昇する可能性があります。
This positive view will be invalidated in the near term if the price turns down and breaks below the 20-day EMA ($0.000028). If that happens, it will suggest that the break above the resistance line may have been a bull trap. The pair may drop to the 50-day SMA ($0.000021).
価格が下落して20日間EMA(0.000028ドル)を下回った場合、この前向きな見方は短期的には無効になるだろう。そうなれば、レジスタンスラインを上抜けたのが強気の罠だった可能性があることが示唆されるだろう。このペアは50日間SMA(0.000021ドル)まで下落する可能性がある。
Toncoin price analysis
トンコイン価格分析
Toncoin (TON) is correcting in an uptrend, but the pullback is finding support at the 38.2% Fibonacci retracement level of $4.78, signaling buying on dips.
トンコイン(TON)は上昇トレンドを修正しているが、反落は38.2%のフィボナッチ・リトレースメントレベルの4.78ドルでサポートされており、押し目買いのシグナルとなっている。
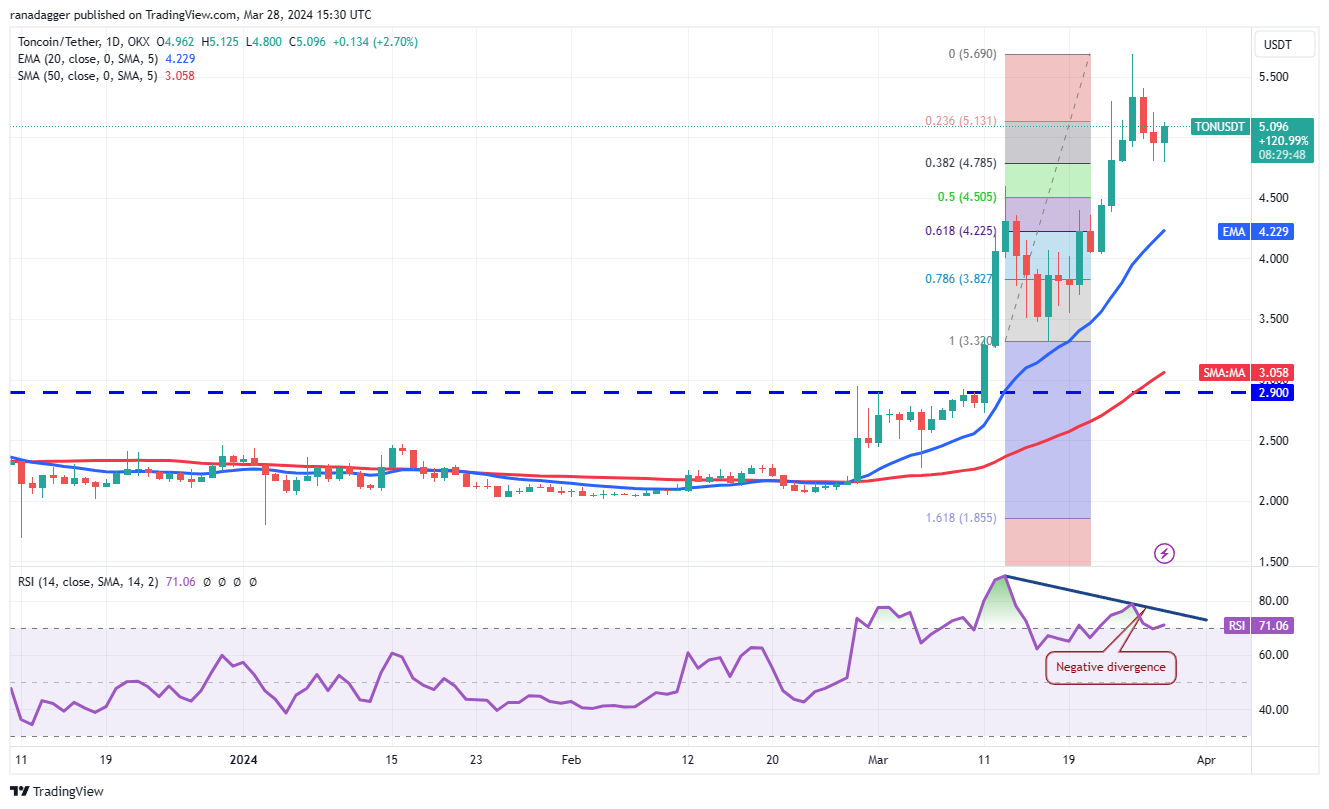
The upsloping moving averages suggest an advantage to the bulls, but the developing negative divergence on the RSI points to a possible consolidation or correction in the short term. If the price turns down and slips below $4.78, it will indicate selling on rallies. The TON/USDT pair could sink to the 20-day EMA ($4.22).
移動平均線の右肩上がりは強気派の優位性を示唆しているが、RSIのマイナスの乖離が進行していることは、短期的には値固めか調整の可能性を示している。価格が下落して4.78ドルを下回る場合は、反発で売りが出る可能性がある。 TON/USDTペアは20日間EMA(4.22ドル)まで下落する可能性がある。
Contrarily, if the rebound sustains, the rally could reach the stiff overhead resistance of $5.69. A break above this level will signal the start of the next leg of the uptrend toward $7.15.
逆に、反発が持続すれば、上昇は5.69ドルの厳しい直上抵抗線に達する可能性がある。このレベルを上抜けた場合は、7.15ドルに向けた上昇トレンドの次のレグの開始の合図となります。
This article does not contain investment advice or recommendations. Every investment and trading move involves risk, and readers should conduct their own research when making a decision.
この記事には投資に関するアドバイスや推奨事項は含まれません。あらゆる投資や取引の動きにはリスクが伴うため、読者は決定を下す際に独自の調査を行う必要があります。
 DogeHome
 Coin_Gabbar
 Coincu
 BlockchainReporter
 CoinPedia News
 TheNewsCrypto
 CFN
CFN


