

Bitcoin’s (BTC) recent fall does not seem to have dented the demand for the spot Bitcoin exchange-traded funds. After five days of successive net outflows last week, demand bounced back sharply with $418 million in net inflows into the ETFs on March 26 and $243 million inflows on March 27, according to Farside Investors data.
比特币(BTC)最近的下跌似乎并没有削弱对现货比特币交易所交易基金的需求。 Farside Investors的数据显示,继上周连续五天净流出后,需求大幅反弹,3月26日ETF净流入4.18亿美元,3月27日净流入2.43亿美元。
BlackRock CEO Larry Fink said in an interview with Fox Business that he was “pleasantly surprised” with the performance of the firm’s spot Bitcoin ETF, which was the “fastest growing ETF in the history of ETFs.” Fink added that he was “very bullish on the long-term viability of Bitcoin.”
贝莱德首席执行官拉里·芬克在接受福克斯商业频道采访时表示,他对该公司现货比特币 ETF 的表现感到“惊喜”,这是“ETF 历史上增长最快的 ETF”。芬克补充说,他“非常看好比特币的长期生存能力”。
On-chain analytics platform CryptoQuant said in its latest “Weekly Crypto Report” that Bitcoin’s demand skyrocketed from “40K Bitcoin at the start of 2024 to 213K Bitcoin” on March 26. That could create a “sell-side liquidity crisis” within the next year.
链上分析平台 CryptoQuant 在其最新的《加密货币每周报告》中表示,比特币的需求从“2024 年初的 4 万比特币飙升至 3 月 26 日的 21.3 万比特币”。这可能会在未来一段时间内引发“卖方流动性危机”。年。
Could Bitcoin continue its recovery and hit a new all-time high before the Bitcoin halving? Will that trigger buying in altcoins? Let’s analyze the charts of the top 10 cryptocurrencies to find out.
比特币能否在减半之前继续复苏并创下历史新高?这会引发山寨币的购买吗?让我们分析一下前 10 名加密货币的图表来找出答案。
Bitcoin price analysis
比特币价格分析
Bitcoin witnessed profit booking on March 26 and 27, but a positive sign is that the bulls maintained the price above the pennant.
比特币在 3 月 26 日和 27 日出现获利盘,但一个积极的迹象是多头将价格维持在三角旗之上。
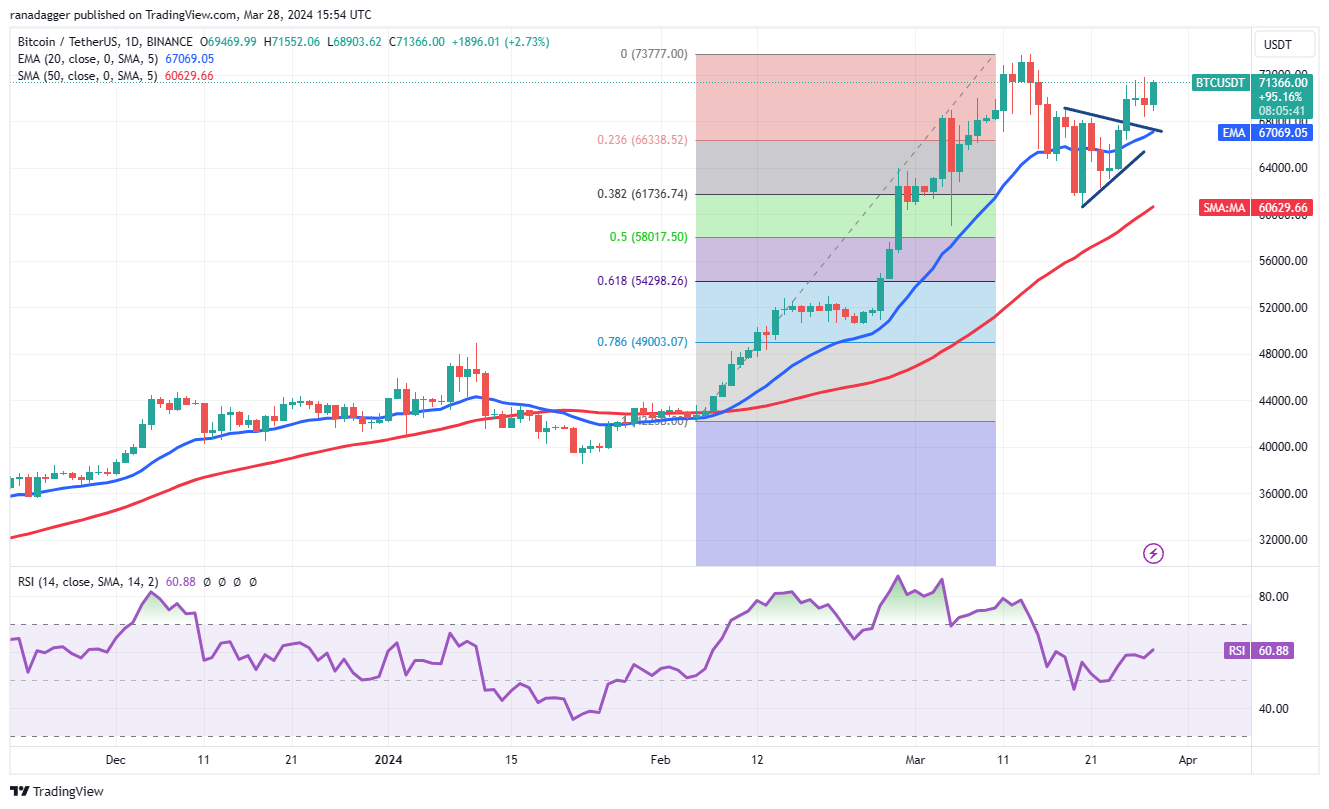
The 20-day exponential moving average (EMA) ($67,069) has started to turn up, and the relative strength index (RSI) is in the positive territory, suggesting that the path of least resistance is to the upside.
20 天指数移动平均线 (EMA)(67,069 美元)已开始上涨,相对强弱指数 (RSI) 处于正值区域,表明阻力最小的路径是上行。
If buyers drive the price above $73,777, the BTC/USDT pair is likely to pick up momentum and rally to $80,000.
如果买家将价格推高至 73,777 美元以上,BTC/USDT 货币对可能会加速上涨至 80,000 美元。
On the contrary, if the price turns down from the current level and breaks below the 20-day EMA, it could open the doors for a potential drop to the 50-day simple moving average ($60,629).
相反,如果价格从当前水平下跌并跌破 20 日均线,则可能为跌至 50 日简单移动平均线(60,629 美元)打开大门。
Ether price analysis
以太币价格分析
Ether (ETH) is facing selling near $3,678, but a positive sign is that the bulls are trying to defend the 20-day EMA ($3,530).
以太坊 (ETH) 面临 3,678 美元附近的抛售,但一个积极的迹象是多头正在努力捍卫 20 日均线(3,530 美元)。
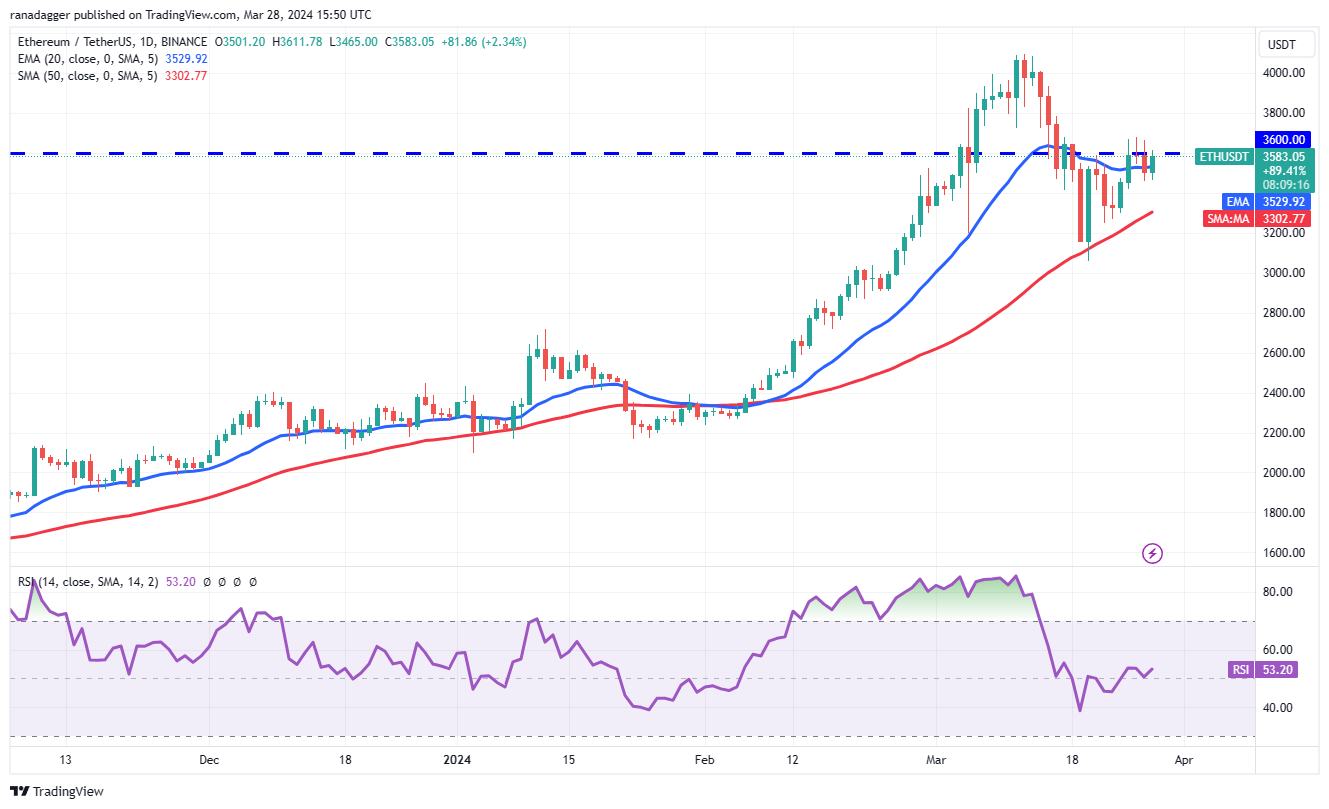
If the price breaks above $3,678, the possibility of a rally to $4,100 increases. This level may act as a stiff hurdle, but if the buyers prevail, the ETH/USDT pair could rally to $4,500 and then to $4,868.
如果价格突破 3,678 美元,上涨至 4,100 美元的可能性就会增加。这一水平可能会成为一个严格的障碍,但如果买家占上风,ETH/USDT 货币对可能会反弹至 4,500 美元,然后升至 4,868 美元。
Conversely, if the price turns down sharply and breaks below $3,460, it will suggest that the bears are not willing to give up. The pair may then slip to the 50-day SMA ($3,302). A slide below this support could start a deeper correction.
相反,如果价格大幅下跌并跌破3,460美元,则表明空头不愿放弃。然后该货币对可能会滑向 50 日移动平均线(3,302 美元)。跌破该支撑位可能会开始更深层次的调整。
BNB price analysis
BNB价格分析
The long wick on BNB’s (BNB) March 25 and 26 candlestick shows that the bears are defending the 61.8% Fibonacci retracement level of $588.
BNB (BNB) 3 月 25 日和 26 日烛台上的长影线表明空头正在捍卫 588 美元的 61.8% 斐波那契回撤位。

If the price turns down from the current level, the BNB/USDT pair could reach the 20-day EMA ($546). This remains the critical level to keep an eye on. If the price rebounds off the 20-day EMA, the pair will again attempt to rise above $600 and reach $645.
如果价格从当前水平下跌,BNB/USDT 货币对可能会触及 20 日均线(546 美元)。这仍然是值得关注的关键水平。如果价格从 20 日均线反弹,该货币对将再次尝试升至 600 美元以上并达到 645 美元。
On the other hand, if the price drops below the 20-day EMA, it will signal that the bears are trying to gain the upper hand. The pair could then drop to the critical support at $495. The bulls may aggressively buy the dips to this level.
另一方面,如果价格跌破 20 日均线,则表明空头正试图占据上风。随后该货币对可能会跌至关键支撑位 495 美元。多头可能会逢低积极买入至该水平。
Solana price analysis
Solana 价格分析
Solana’s (SOL) recovery is faltering at $196, indicating that the bears are selling on relief rallies near the overhead resistance of $205.
Solana (SOL) 的复苏在 196 美元处徘徊,表明空头在 205 美元上方阻力位附近的反弹中抛售。
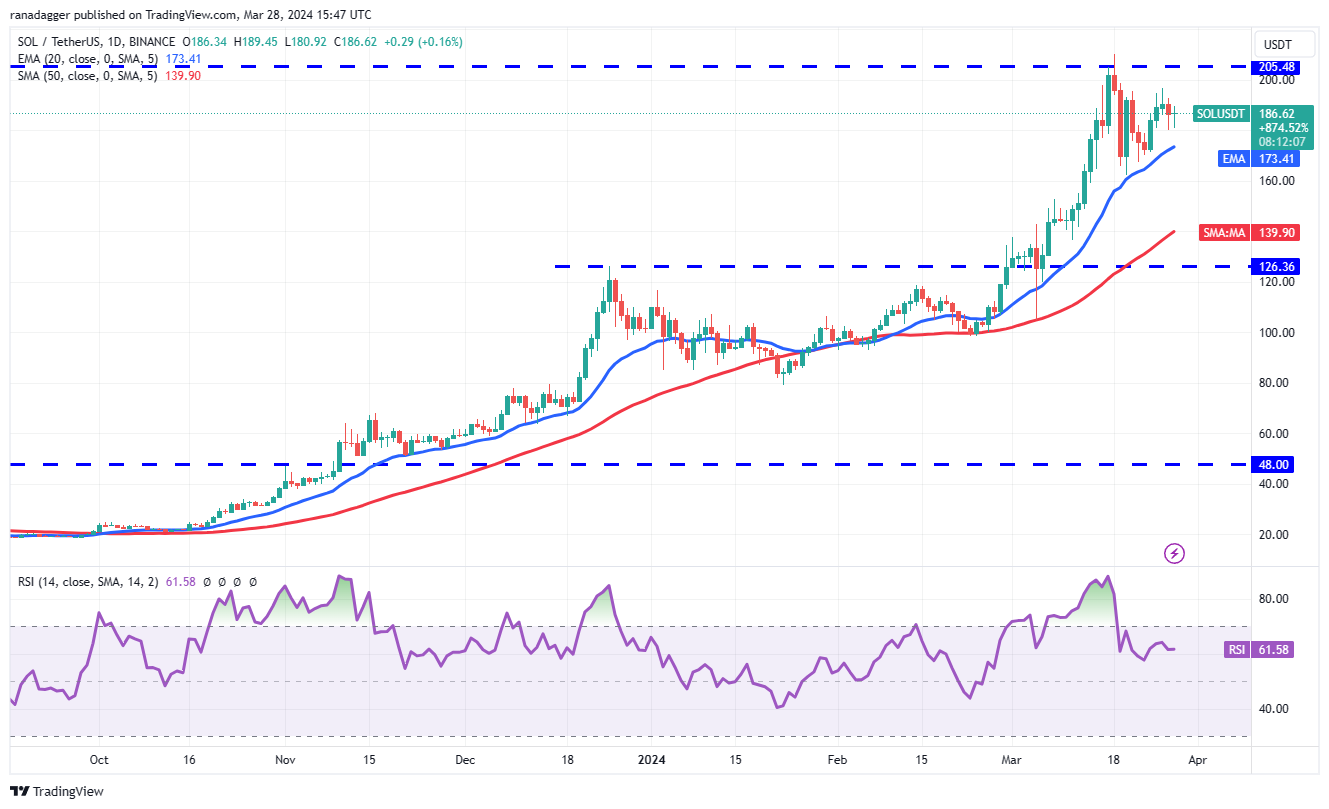
The bears will try to pull the price to the 20-day EMA ($173), which is a crucial level to keep an eye on. If the price plunges below the 20-day EMA, it will suggest the bears are in the driver’s seat. The SOL/USDT pair could decline to $162 and below that to the 50-day SMA ($140).
空头将试图将价格拉至 20 日均线(173 美元),这是一个值得关注的关键水平。如果价格跌破 20 日均线,则表明空头占据主导地位。 SOL/USDT 货币对可能会跌至 162 美元,并低于 50 日移动平均线(140 美元)。
Instead, if the price turns up from the current level or rebounds off the 20-day EMA, it will indicate solid demand at lower levels. That will enhance the prospects of a break above $205. If that happens, the pair may start its journey to $267.
相反,如果价格从当前水平回升或从 20 日均线反弹,则表明较低水平的需求强劲。这将增强其突破 205 美元的前景。如果发生这种情况,该货币对可能会开始上涨至 267 美元。
XRP price analysis
瑞波币价格分析
XRP (XRP) has been stuck between the uptrend line and $0.67 for the past few days, indicating indecision among the buyers and sellers.
过去几天,XRP (XRP) 一直徘徊在上升趋势线和 0.67 美元之间,表明买家和卖家犹豫不决。
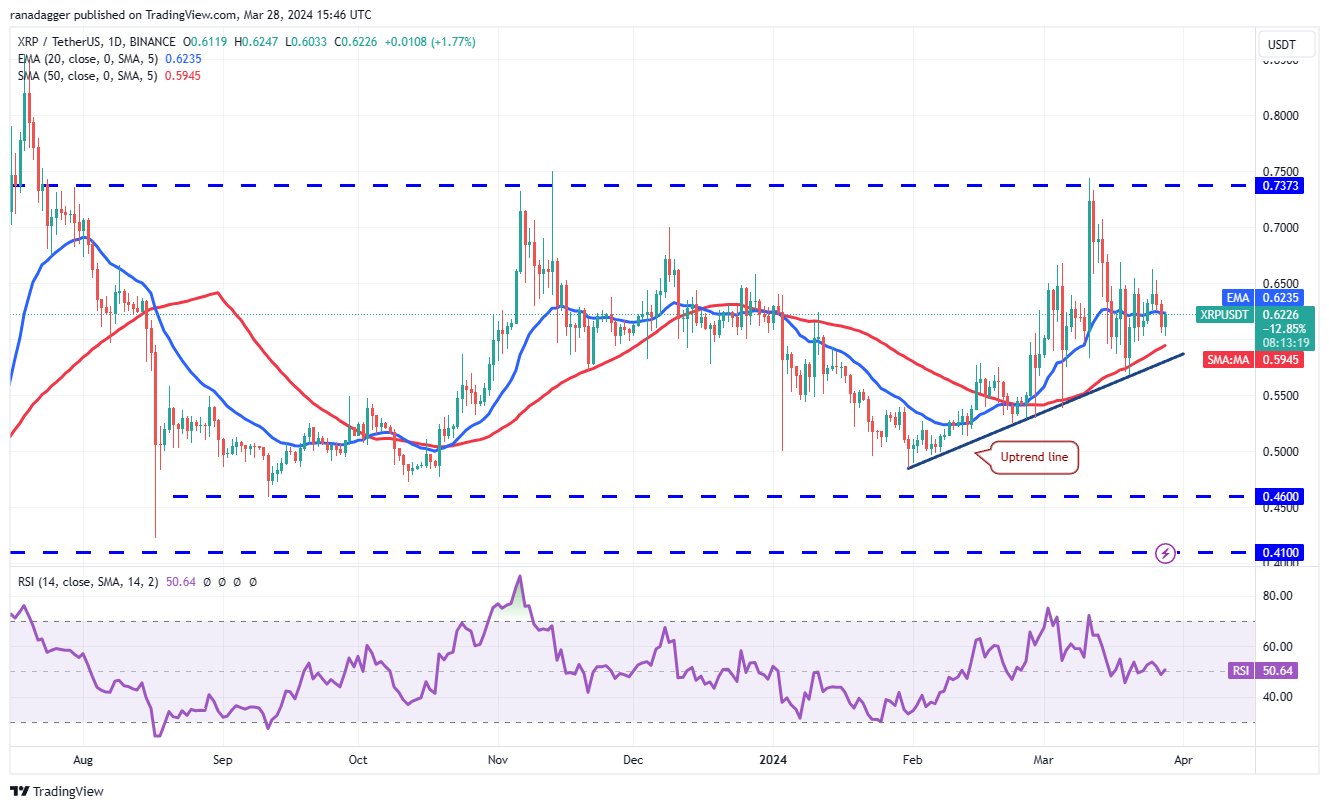
If the price maintains below the 20-day EMA ($0.62), the XRP/USDT pair could drop to the uptrend line. A strong rebound off this level will suggest that the range-bound action may continue for a few more days.
如果价格维持在 20 日均线(0.62 美元)下方,XRP/USDT 货币对可能会跌至上升趋势线。从该水平强劲反弹将表明区间波动可能会持续几天。
The next trending move is likely to begin on a break above $0.67 or on a drop below the uptrend line. Above $0.67, the pair could start a rally to the formidable hurdle at $0.74. On the downside, a break below the uptrend line could sink the pair to $0.52.
下一个趋势走势可能会在突破 0.67 美元或跌破上升趋势线时开始。突破 0.67 美元后,该货币对可能会开始反弹至 0.74 美元的强大关口。下行方面,跌破上升趋势线可能导致该货币对跌至 0.52 美元。
Cardano price analysis
卡尔达诺价格分析
The long wick on Cardano’s (ADA) March 26 candlestick suggests that the bears are trying to keep the price below $0.68.
卡尔达诺 (ADA) 3 月 26 日烛台上的长影线表明空头正试图将价格保持在 0.68 美元以下。
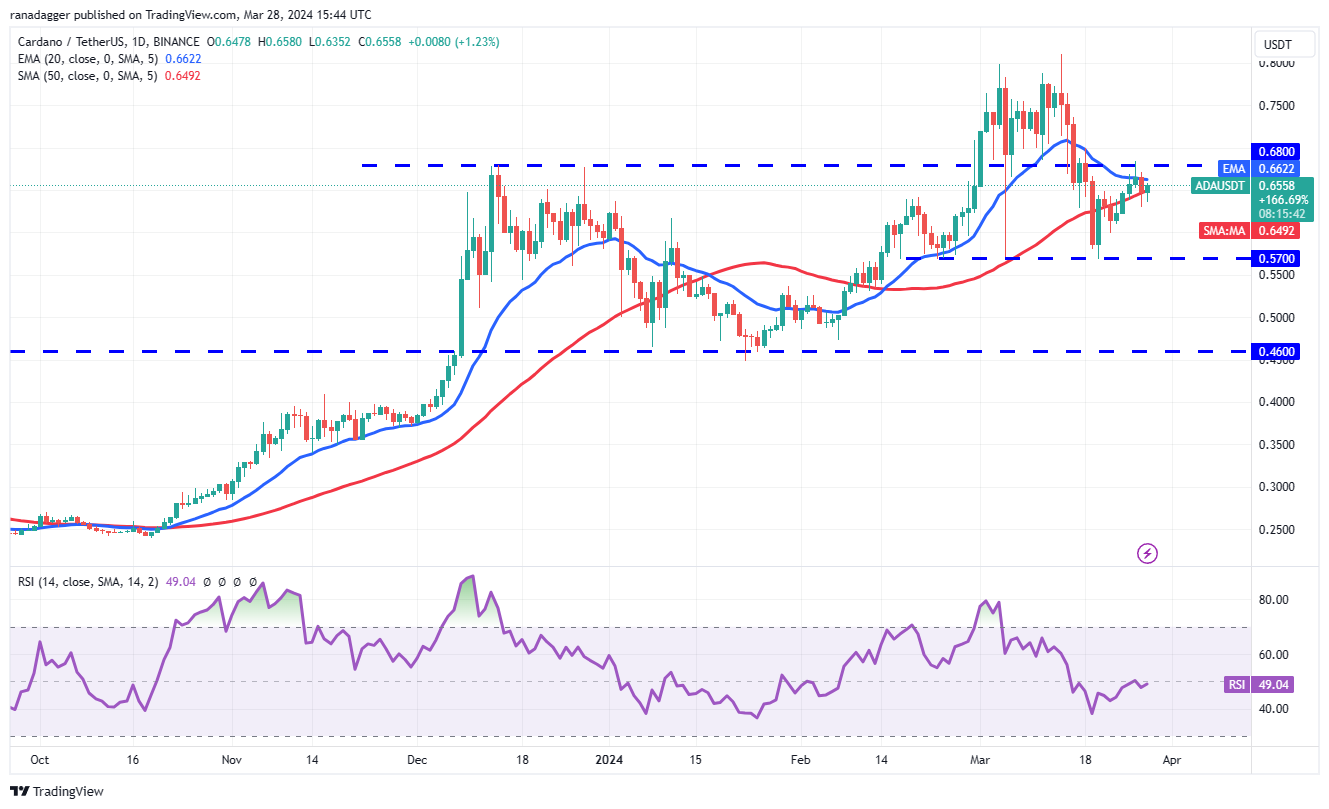
If the price remains below the moving averages, it will signal that the ADA/USDT pair could swing between $0.57 and $0.68 for a while. The flattening 20-day EMA ($0.66) and the RSI near the midpoint suggest a consolidation in the near term.
如果价格仍低于移动平均线,则表明 ADA/USDT 货币对可能会在 0.57 美元至 0.68 美元之间波动一段时间。趋平的 20 日均线(0.66 美元)和 RSI 接近中点表明近期将出现盘整。
However, if the price turns up from the current level and breaks above $0.70, it will indicate that the bulls are back in the game. The pair may then attempt a rally to $0.81, where the bears may pose a strong challenge.
然而,如果价格从当前水平回升并突破 0.70 美元,则表明多头重新回归游戏。然后,该货币对可能会尝试反弹至 0.81 美元,空头可能会在此构成强大的挑战。
Dogecoin price analysis
狗狗币价格分析
Dogecoin (DOGE) soared above the $0.19 to $0.21 overhead resistance zone on March 28, indicating aggressive buying by the bulls.
3 月 28 日,狗狗币 (DOGE) 飙升至 0.19 美元至 0.21 美元上方阻力区上方,表明多头积极买盘。
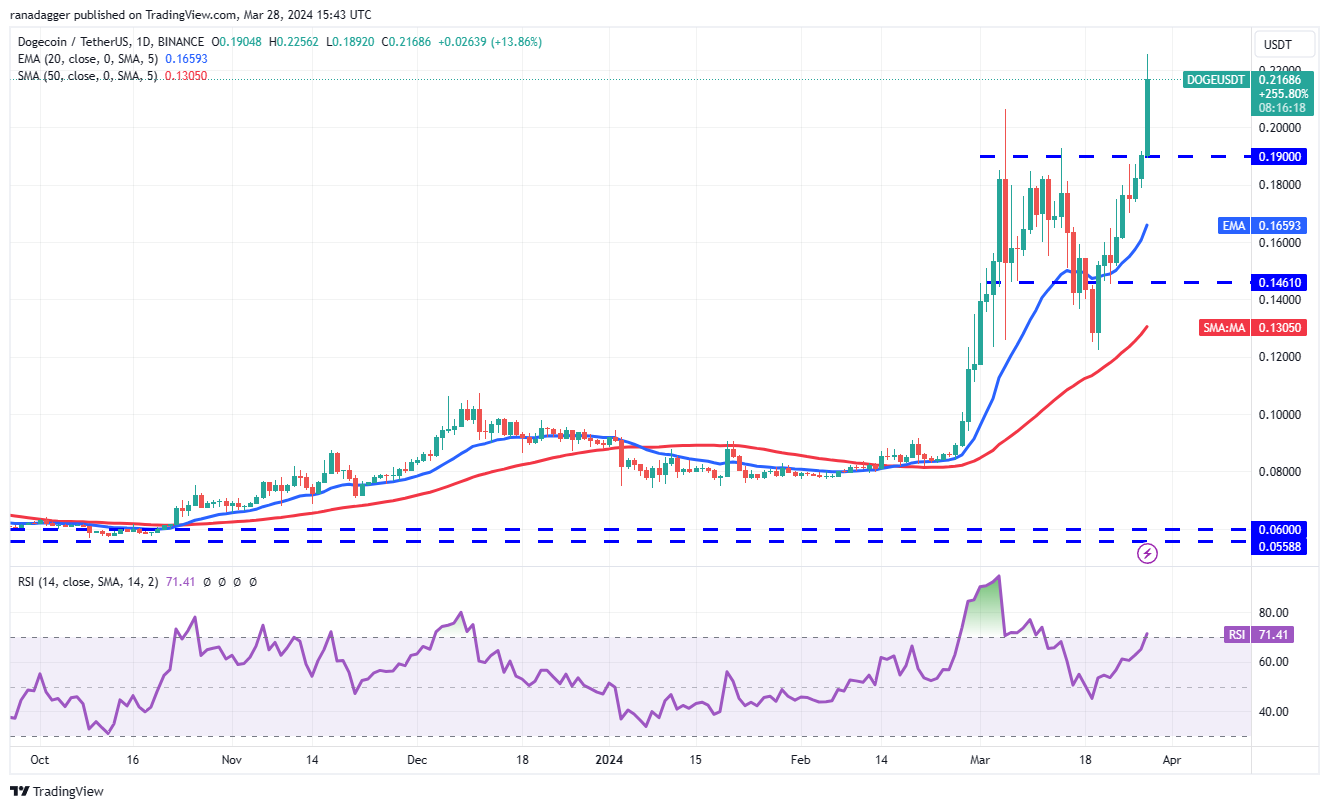
The upsloping moving averages and the RSI in the overbought zone suggest that bulls are in command. There is a minor resistance at $0.23, but if buyers bulldoze their way through, the DOGE/USDT pair could rally to $0.30 and then to $0.35.
向上倾斜的移动平均线和超买区域的 RSI 表明多头处于主导地位。 0.23 美元有一个小阻力,但如果买家全力突破,DOGE/USDT 货币对可能会反弹至 0.30 美元,然后升至 0.35 美元。
If bears want to prevent the upside, they will have to quickly pull the price back below $0.19. If they do that, it will trap the aggressive bulls, resulting in long liquidation. The pair could then slump to the 20-day EMA ($0.16).
如果空头想要阻止上涨,他们将不得不迅速将价格拉回 0.19 美元以下。如果他们这样做,就会困住激进的多头,导致多头清算。然后该货币对可能会跌至 20 日均线(0.16 美元)。
Related: Bitcoin whales copy classic bull market moves as BTC price eyes $72K
相关:比特币鲸鱼复制经典牛市走势,比特币价格达到 7.2 万美元
Avalanche price analysis
雪崩价格分析
Avalanche’s (AVAX) price action of the past few days has formed a pennant, indicating indecision between the bulls and the bears.
Avalanche (AVAX)过去几天的价格走势已形成三角旗,表明多头和空头之间犹豫不决。
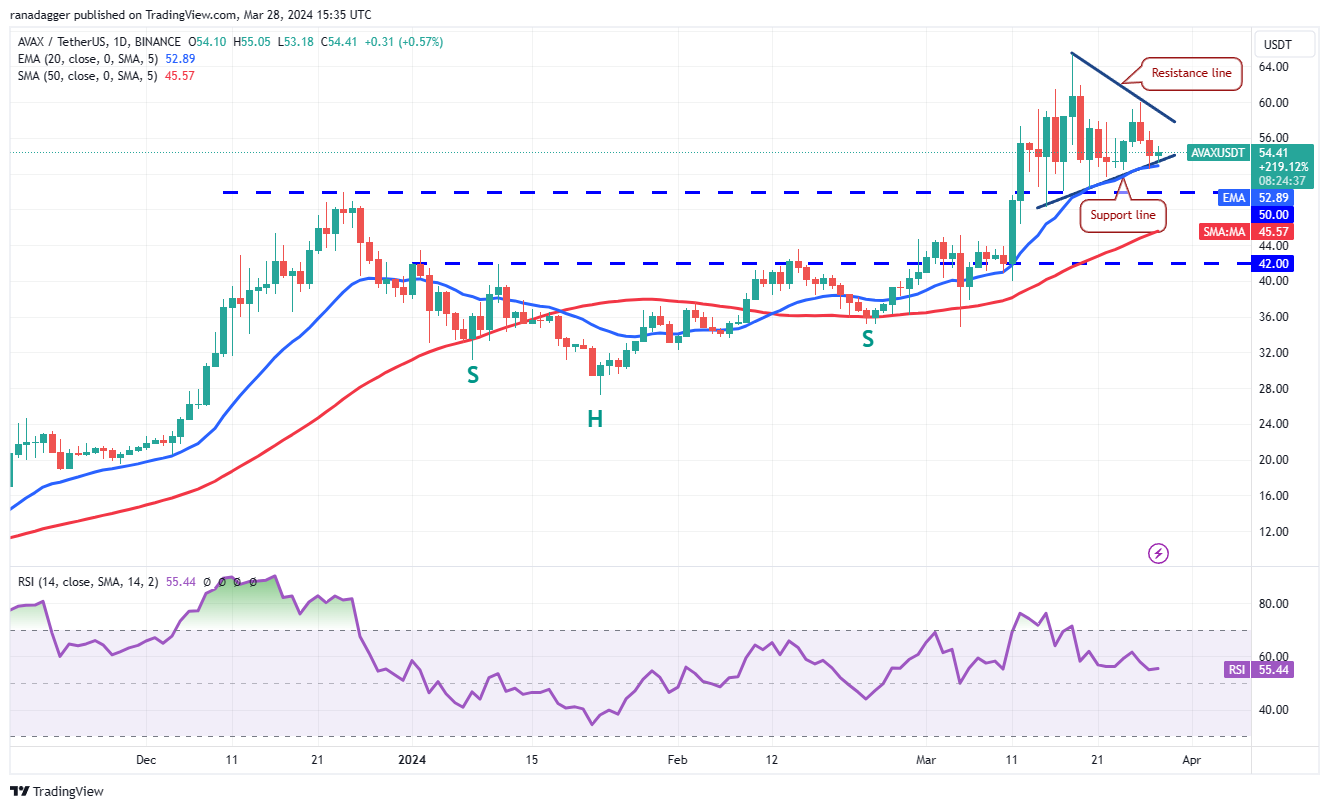
The upsloping 20-day EMA ($52) and the RSI in the positive territory indicate a slight advantage to buyers.
上升的 20 日均线(52 美元)和 RSI 处于正值区域表明买家略有优势。
The bulls will try to defend the support line of the pennant and push the price toward the resistance line. A break and close above the pennant will signal that the AVAX/USDT pair could resume the uptrend. The pair may rise to $65 and later to the pattern target of $76.
多头将试图捍卫三角旗的支撑线,并将价格推向阻力线。突破并收盘于三角旗上方将表明 AVAX/USDT 货币对可能会恢复上升趋势。该货币对可能会升至 65 美元,随后升至 76 美元的形态目标。
Alternatively, if the price breaks below the pennant, it will suggest that the bears have overpowered the bulls. There is strong support at $50, but if this level gives way, the pair could tumble to the 50-day SMA ($45).
或者,如果价格跌破三角旗,则表明空头已经压倒了多头。 50 美元有强劲支撑,但如果该水平失守,该货币对可能会跌至 50 日移动平均线(45 美元)。
Shiba Inu price analysis
柴犬价格分析
Shiba Inu’s (SHIB) recovery climbed above the resistance line on March 26, indicating that the selling pressure is reducing.
柴犬 (SHIB) 的复苏在 3 月 26 日攀升至阻力线上方,表明抛售压力正在减轻。
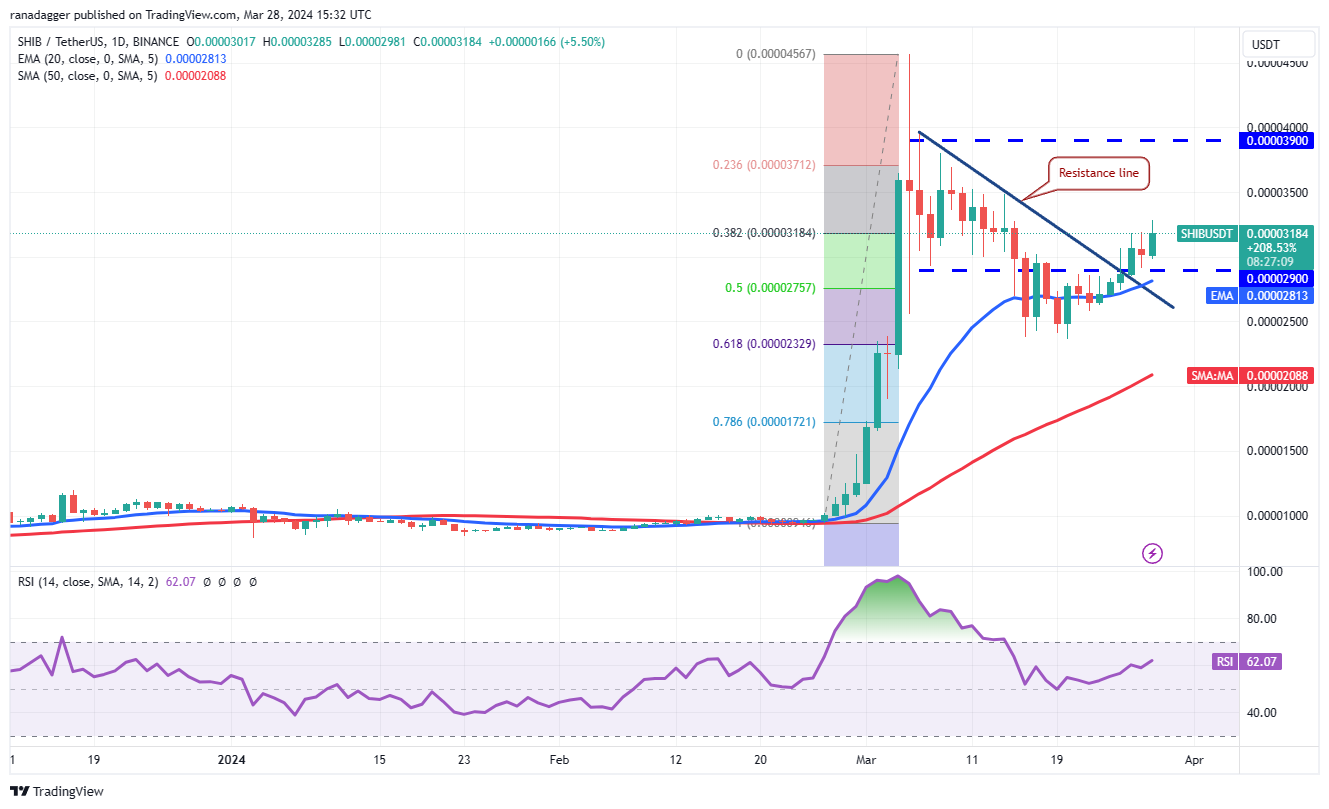
The SHIB/USDT pair is likely to rise to $0.000035 where the bears are again expected to mount a strong defense. A break above this level could open the doors for a possible rise to $0.000039.
SHIB/USDT 货币对可能会上涨至 0.000035 美元,预计空头将再次发起强有力的防御。突破该水平可能为上涨至 0.000039 美元打开大门。
This positive view will be invalidated in the near term if the price turns down and breaks below the 20-day EMA ($0.000028). If that happens, it will suggest that the break above the resistance line may have been a bull trap. The pair may drop to the 50-day SMA ($0.000021).
如果价格下跌并跌破 20 日均线(0.000028 美元),这种积极观点将在短期内失效。如果发生这种情况,则表明突破阻力线可能是牛市陷阱。该货币对可能会跌至 50 日移动平均线(0.000021 美元)。
Toncoin price analysis
通币价格分析
Toncoin (TON) is correcting in an uptrend, but the pullback is finding support at the 38.2% Fibonacci retracement level of $4.78, signaling buying on dips.
Toncoin (TON) 在上升趋势中进行修正,但回调在 4.78 美元的 38.2% 斐波那契回撤位找到支撑,表明逢低买入。
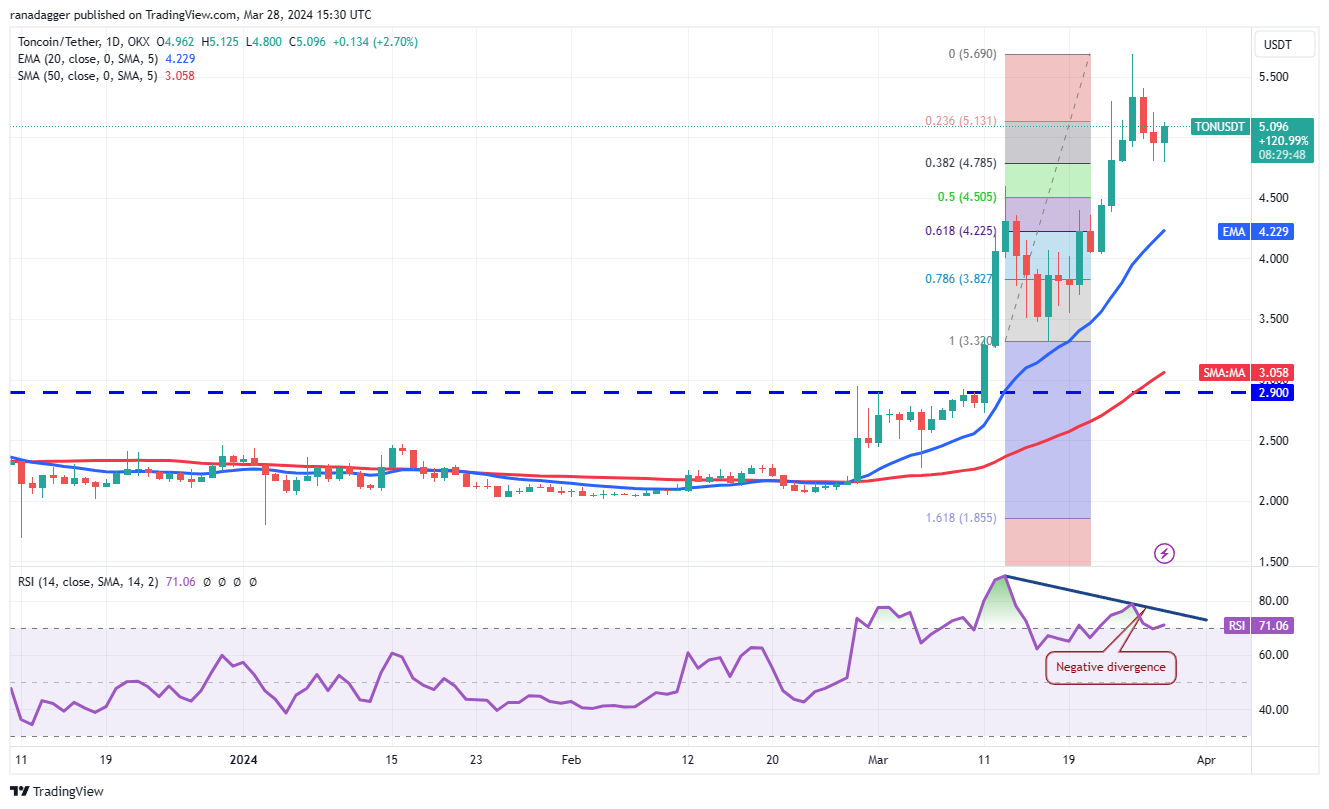
The upsloping moving averages suggest an advantage to the bulls, but the developing negative divergence on the RSI points to a possible consolidation or correction in the short term. If the price turns down and slips below $4.78, it will indicate selling on rallies. The TON/USDT pair could sink to the 20-day EMA ($4.22).
向上倾斜的移动平均线表明多头具有优势,但 RSI 的负背离表明短期内可能出现盘整或调整。如果价格下跌并跌破 4.78 美元,则表明逢高抛售。 TON/USDT 货币对可能会跌至 20 日均线(4.22 美元)。
Contrarily, if the rebound sustains, the rally could reach the stiff overhead resistance of $5.69. A break above this level will signal the start of the next leg of the uptrend toward $7.15.
相反,如果反弹持续,反弹可能会触及 5.69 美元的上方阻力位。突破该水平将标志着下一阶段上涨趋势的开始,朝向 7.15 美元。
This article does not contain investment advice or recommendations. Every investment and trading move involves risk, and readers should conduct their own research when making a decision.
本文不包含投资建议或建议。每一项投资和交易行为都涉及风险,读者在做出决定时应自行研究。
 DogeHome
 Coincu
 Coin Edition
 Coin_Gabbar
 Coincu
 BlockchainReporter
 CoinPedia News


