
The struggle of Bitcoin to surpass the $38,000 resistance level has affected the altcoin market, including Shiba Inu (SHIB). SHIB, a popular meme coin that was launched in August 2020 and quickly skyrocketed by an unbelievable 10 million percent, creating dozens of new millionaires, recently formed a local peak at $0.00000965 and is currently consolidating within two converging trend lines since last week. This formation indicates a potential breakout of the $0.00001 barrier for SHIB, potentially helping it reach new highs.
La lucha de Bitcoin por superar el nivel de resistencia de 38.000 dólares ha afectado al mercado de altcoins, incluido Shiba Inu (SHIB). SHIB, una popular moneda meme que se lanzó en agosto de 2020 y se disparó rápidamente en un increíble 10 millones por ciento, creando docenas de nuevos millonarios, recientemente formó un pico local de $0,00000965 y actualmente se está consolidando dentro de dos líneas de tendencia convergentes desde la semana pasada. Esta formación indica una posible ruptura de la barrera de $ 0,00001 para SHIB, lo que podría ayudarlo a alcanzar nuevos máximos.
Shiba Inu Price Analysis
Análisis de precios de Shiba Inu
In the past 30 days, the price of Shiba Inu has experienced significant growth, rising from $0.00000612 to the current trading price of $0.00000863, representing a 30% increase. However, this upward trend encountered resistance around the $0.00000965 level, coinciding with a period of increased uncertainty in the market.
En los últimos 30 días, el precio de Shiba Inu ha experimentado un crecimiento significativo, pasando de 0,00000612 dólares al precio de negociación actual de 0,00000863 dólares, lo que representa un aumento del 30%. Sin embargo, esta tendencia alcista encontró resistencia alrededor del nivel de $0,00000965, coincidiendo con un período de mayor incertidumbre en el mercado.
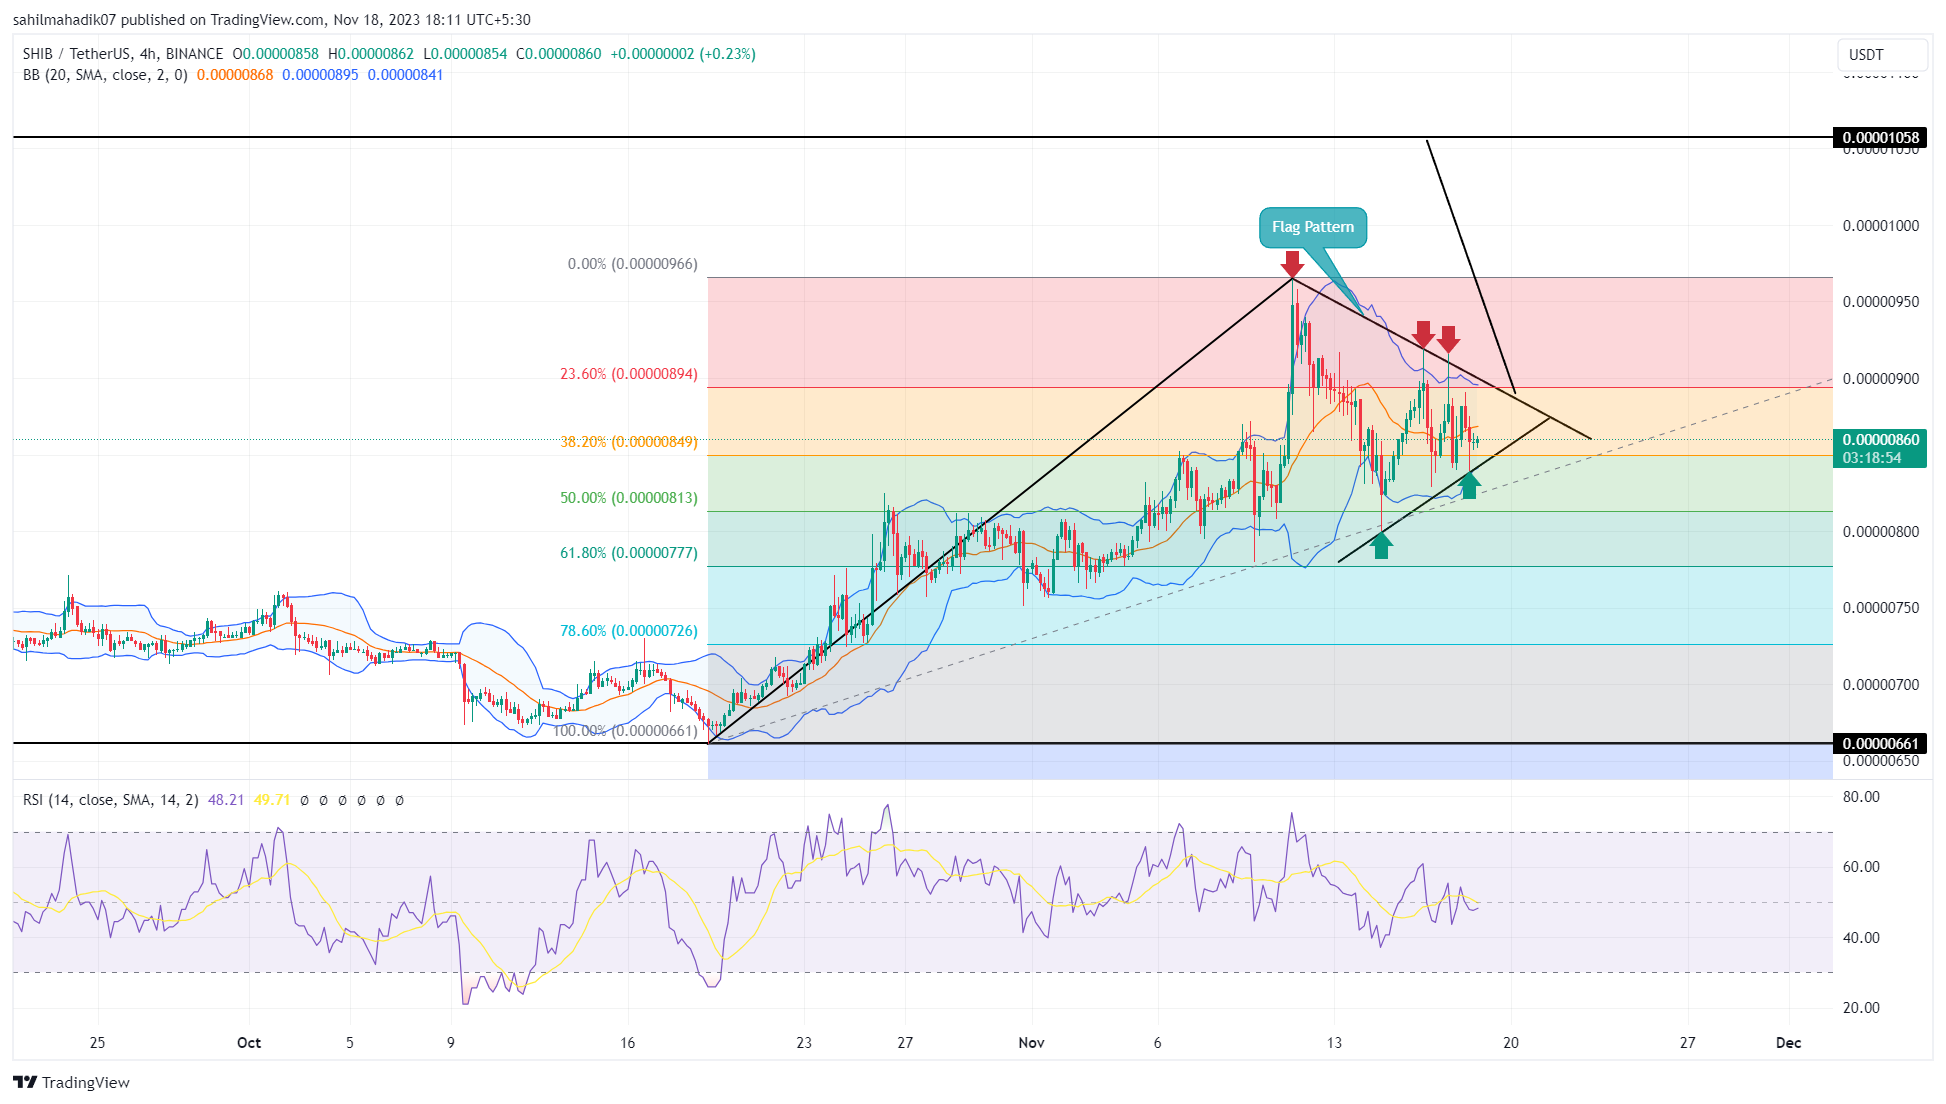
This led to a temporary pullback, reaching a level of $0.000008, which corresponds to the 50% Fibonacci retracement level. In the context of a long-term bull run, this pullback is generally seen as a healthy correction.
Esto provocó un retroceso temporal, alcanzando un nivel de 0,000008 dólares, que corresponde al nivel de retroceso de Fibonacci del 50%. En el contexto de una corrida alcista a largo plazo, este retroceso generalmente se considera una corrección saludable.
When examining the 4-hour timeframe chart, it can be observed that this consolidation phase has formed a continuation pattern known as a “flag.” Typically, this formation involves a brief period of horizontal movement before a definitive upward breakout. If SHIB breaks above the upper trend line of this flag formation, it could potentially target $0.0000150 as the initial price objective, representing an 18% potential gain.
Al examinar el gráfico de período de 4 horas, se puede observar que esta fase de consolidación ha formado un patrón de continuación conocido como "bandera". Normalmente, esta formación implica un breve período de movimiento horizontal antes de una ruptura alcista definitiva. Si SHIB supera la línea de tendencia superior de esta formación de bandera, podría potencialmente apuntar a $ 0,0000150 como objetivo de precio inicial, lo que representa una ganancia potencial del 18%.
Comparison of SHIB and DOGE Performance
Comparación del rendimiento de SHIB y DOGE
When comparing the price behavior of SHIB with its main competitor, Dogecoin (DOGE), over the past three months, it can be seen that DOGE has shown stronger momentum, consistently forming new highs and lows. On the other hand, SHIB is struggling to surpass the $0.00000969 level. Considering the prevailing bullish trend in the market, Dogecoin may offer more favorable opportunities for long positions.
Al comparar el comportamiento de los precios de SHIB con el de su principal competidor, Dogecoin (DOGE), durante los últimos tres meses, se puede ver que DOGE ha mostrado un impulso más fuerte, formando constantemente nuevos máximos y mínimos. Por otro lado, SHIB está luchando por superar el nivel de 0,00000969 dólares. Teniendo en cuenta la tendencia alcista predominante en el mercado, Dogecoin puede ofrecer oportunidades más favorables para posiciones largas.
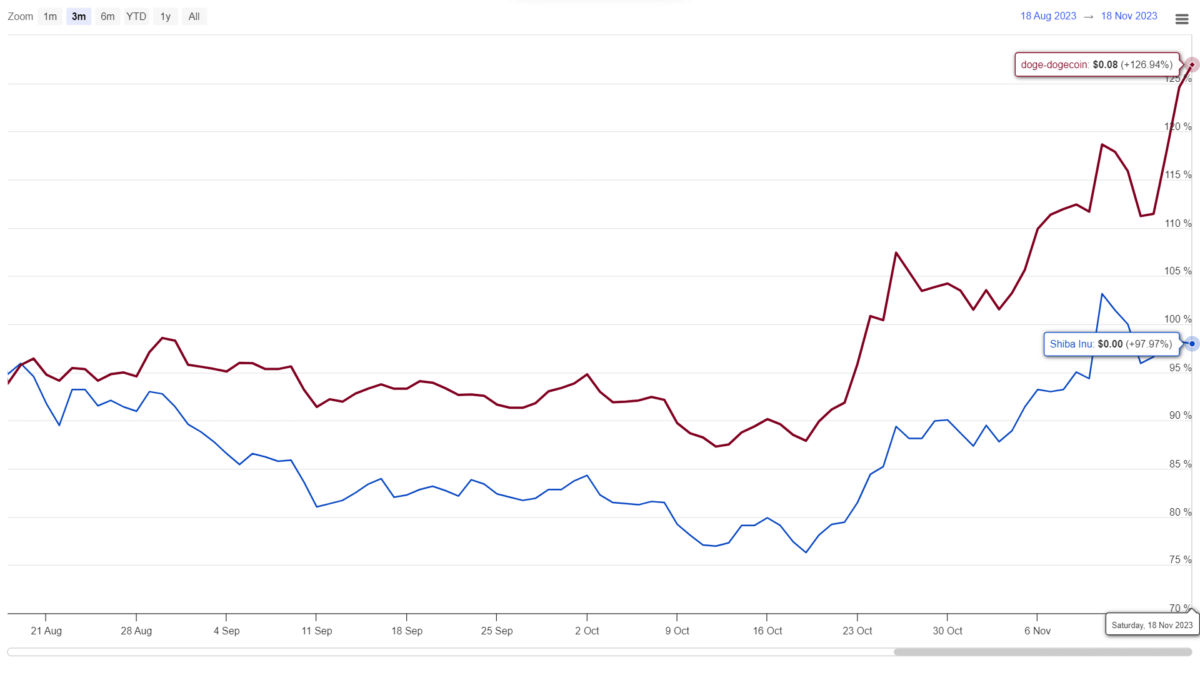
Meanwhile, SHIB is forming declining lows on the daily timeframe’s Relative Strength Index (RSI), indicating selling pressure. However, the ongoing upward trend in SHIB’s price suggests a higher probability of further upward movement. The converging Bollinger Bands (BB) along with RSI indicate that the market is currently in a typical correction phase before a potential breakout or continuation of the trend.
Mientras tanto, SHIB está formando mínimos decrecientes en el índice de fuerza relativa (RSI) del período diario, lo que indica presión de venta. Sin embargo, la actual tendencia alcista en el precio de SHIB sugiere una mayor probabilidad de un mayor movimiento alcista. Las Bandas de Bollinger (BB) convergentes junto con el RSI indican que el mercado se encuentra actualmente en una fase de corrección típica antes de una posible ruptura o continuación de la tendencia.
Continue Reading: https://en.coin-turk.com/shiba-inu-price-analysis-can-shib-break-the-0-00001-barrier/Continuar leyendo: https://en.coin-turk.com/shiba-inu-price-analysis-can-shib-break-the-0-00001-barrier/


 DogeHome
 CFN
CFN The Bit Journal
 Crypto Intelligence
 DeFi Planet
 Crypto News Land
 BH NEWS
 DogeHome
 CryptoPotato_News


