
The struggle of Bitcoin to surpass the $38,000 resistance level has affected the altcoin market, including Shiba Inu (SHIB). SHIB, a popular meme coin that was launched in August 2020 and quickly skyrocketed by an unbelievable 10 million percent, creating dozens of new millionaires, recently formed a local peak at $0.00000965 and is currently consolidating within two converging trend lines since last week. This formation indicates a potential breakout of the $0.00001 barrier for SHIB, potentially helping it reach new highs.
La lutte du Bitcoin pour dépasser le niveau de résistance de 38 000 $ a affecté le marché de l’altcoin, y compris Shiba Inu (SHIB). SHIB, une pièce mème populaire qui a été lancée en août 2020 et a rapidement grimpé d'un incroyable 10 millions de pour cent, créant des dizaines de nouveaux millionnaires, a récemment atteint un sommet local à 0,00000965 $ et se consolide actuellement au sein de deux lignes de tendance convergentes depuis la semaine dernière. Cette formation indique une cassure potentielle de la barrière de 0,00001 $ pour SHIB, l'aidant potentiellement à atteindre de nouveaux sommets.
Shiba Inu Price Analysis
Analyse des prix du Shiba Inu
In the past 30 days, the price of Shiba Inu has experienced significant growth, rising from $0.00000612 to the current trading price of $0.00000863, representing a 30% increase. However, this upward trend encountered resistance around the $0.00000965 level, coinciding with a period of increased uncertainty in the market.
Au cours des 30 derniers jours, le prix du Shiba Inu a connu une croissance significative, passant de 0,00000612 $ au cours actuel de 0,00000863 $, soit une augmentation de 30 %. Cependant, cette tendance à la hausse a rencontré une résistance autour du niveau de 0,00000965 $, coïncidant avec une période d'incertitude accrue sur le marché.
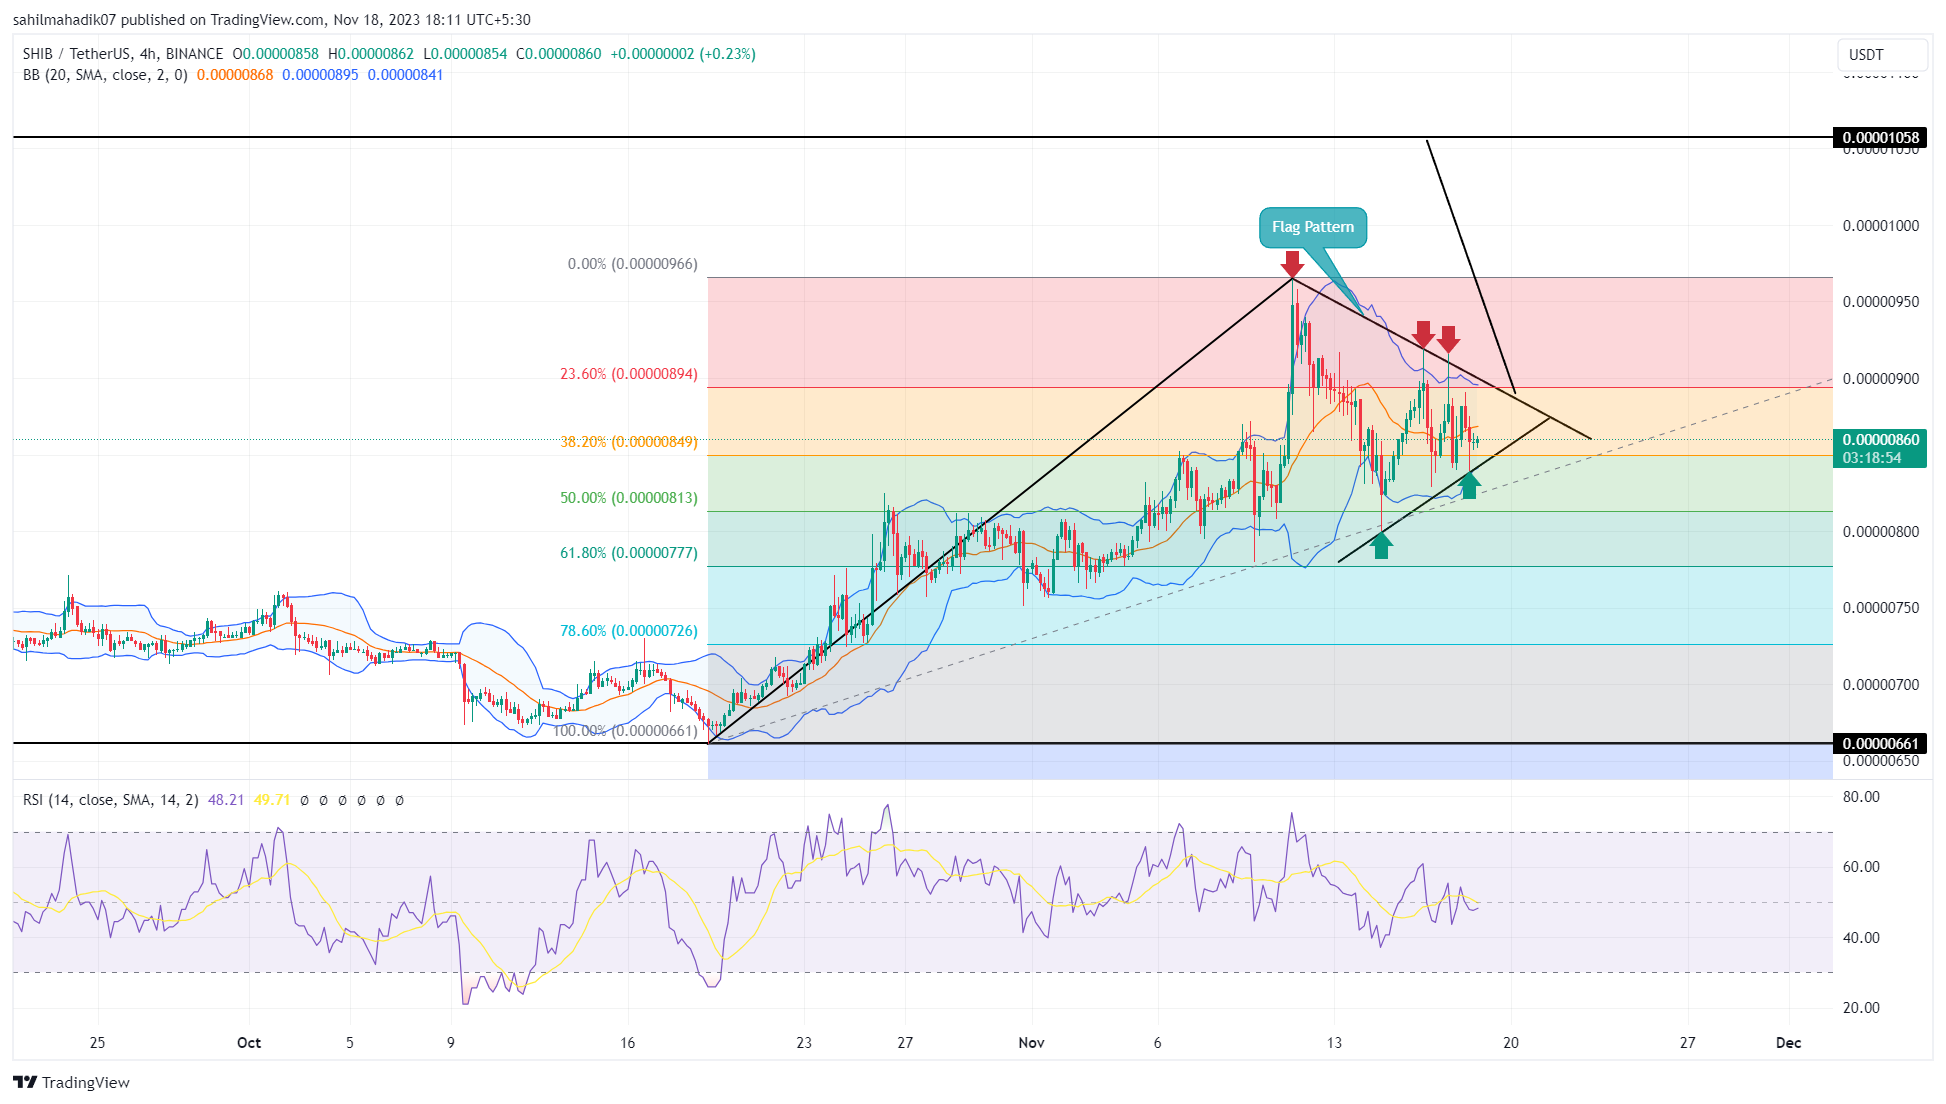
This led to a temporary pullback, reaching a level of $0.000008, which corresponds to the 50% Fibonacci retracement level. In the context of a long-term bull run, this pullback is generally seen as a healthy correction.
Cela a conduit à un retrait temporaire, atteignant un niveau de 0,000008 $, ce qui correspond au niveau de retracement de Fibonacci de 50 %. Dans le contexte d’une tendance haussière à long terme, ce repli est généralement considéré comme une correction saine.
When examining the 4-hour timeframe chart, it can be observed that this consolidation phase has formed a continuation pattern known as a “flag.” Typically, this formation involves a brief period of horizontal movement before a definitive upward breakout. If SHIB breaks above the upper trend line of this flag formation, it could potentially target $0.0000150 as the initial price objective, representing an 18% potential gain.
En examinant le graphique sur une période de 4 heures, on peut observer que cette phase de consolidation a formé un modèle de continuation appelé « drapeau ». Généralement, cette formation implique une brève période de mouvement horizontal avant une cassure ascendante définitive. Si SHIB dépasse la ligne de tendance supérieure de cette formation de drapeau, il pourrait potentiellement cibler 0,0000150 $ comme objectif de prix initial, ce qui représente un gain potentiel de 18 %.
Comparison of SHIB and DOGE Performance
Comparaison des performances SHIB et DOGE
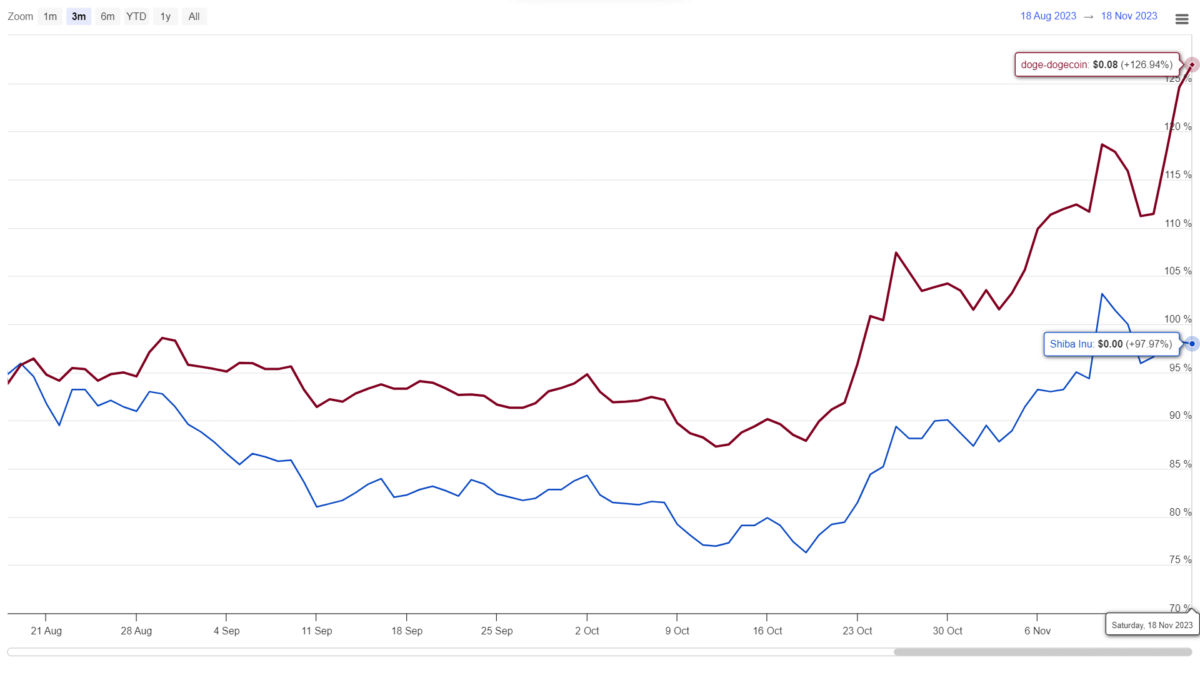
When comparing the price behavior of SHIB with its main competitor, Dogecoin (DOGE), over the past three months, it can be seen that DOGE has shown stronger momentum, consistently forming new highs and lows. On the other hand, SHIB is struggling to surpass the $0.00000969 level. Considering the prevailing bullish trend in the market, Dogecoin may offer more favorable opportunities for long positions.
En comparant le comportement des prix de SHIB avec celui de son principal concurrent, Dogecoin (DOGE), au cours des trois derniers mois, on peut constater que DOGE a montré une dynamique plus forte, formant constamment de nouveaux hauts et bas. D’un autre côté, SHIB a du mal à dépasser le niveau de 0,00000969 $. Compte tenu de la tendance haussière dominante du marché, Dogecoin peut offrir des opportunités plus favorables pour les positions longues.
Meanwhile, SHIB is forming declining lows on the daily timeframe’s Relative Strength Index (RSI), indicating selling pressure. However, the ongoing upward trend in SHIB’s price suggests a higher probability of further upward movement. The converging Bollinger Bands (BB) along with RSI indicate that the market is currently in a typical correction phase before a potential breakout or continuation of the trend.
Pendant ce temps, SHIB forme des plus bas en baisse sur l’indice de force relative (RSI) de la période quotidienne, indiquant une pression à la vente. Cependant, la tendance à la hausse continue du prix du SHIB suggère une probabilité plus élevée d’un nouveau mouvement à la hausse. Les bandes de Bollinger (BB) convergentes ainsi que le RSI indiquent que le marché est actuellement dans une phase de correction typique avant une éventuelle cassure ou poursuite de la tendance.
Continue Reading: https://en.coin-turk.com/shiba-inu-price-analysis-can-shib-break-the-0-00001-barrier/Continuer la lecture : https://en.coin-turk.com/shiba-inu-price-analysis-can-shib-break-the-0-00001-barrier/


 COINTURK NEWS
 BH NEWS
 DogeHome
 Crypto News Land
 Coincu
 CoinPedia News
 DogeHome
 BlockchainReporter
 Optimisus


