
The struggle of Bitcoin to surpass the $38,000 resistance level has affected the altcoin market, including Shiba Inu (SHIB). SHIB, a popular meme coin that was launched in August 2020 and quickly skyrocketed by an unbelievable 10 million percent, creating dozens of new millionaires, recently formed a local peak at $0.00000965 and is currently consolidating within two converging trend lines since last week. This formation indicates a potential breakout of the $0.00001 barrier for SHIB, potentially helping it reach new highs.
ビットコインが38,000ドルのレジスタンスレベルを突破しようと奮闘していることは、柴犬(SHIB)を含むアルトコイン市場に影響を与えている。 2020年8月に発売され、すぐに信じられないほど1,000万パーセントも急騰し、数十人の新たな億万長者を生み出した人気のミームコインであるSHIBは、最近0.00000965ドルで局所的なピークを形成し、現在は先週以来2つの収束するトレンドライン内で安定している。この形成はSHIBの0.00001ドルの壁を突破する可能性を示しており、SHIBが新たな高値に到達するのに役立つ可能性があります。
Shiba Inu Price Analysis
柴犬の価格分析
In the past 30 days, the price of Shiba Inu has experienced significant growth, rising from $0.00000612 to the current trading price of $0.00000863, representing a 30% increase. However, this upward trend encountered resistance around the $0.00000965 level, coinciding with a period of increased uncertainty in the market.
過去 30 日間で、柴犬の価格は大幅に上昇し、0.00000612 ドルから現在の取引価格の 0.00000863 ドルまで上昇しました。これは 30% の上昇に相当します。しかし、この上昇傾向は、市場の不確実性が高まった時期と一致して、0.00000965 ドルのレベル付近で抵抗に遭遇しました。
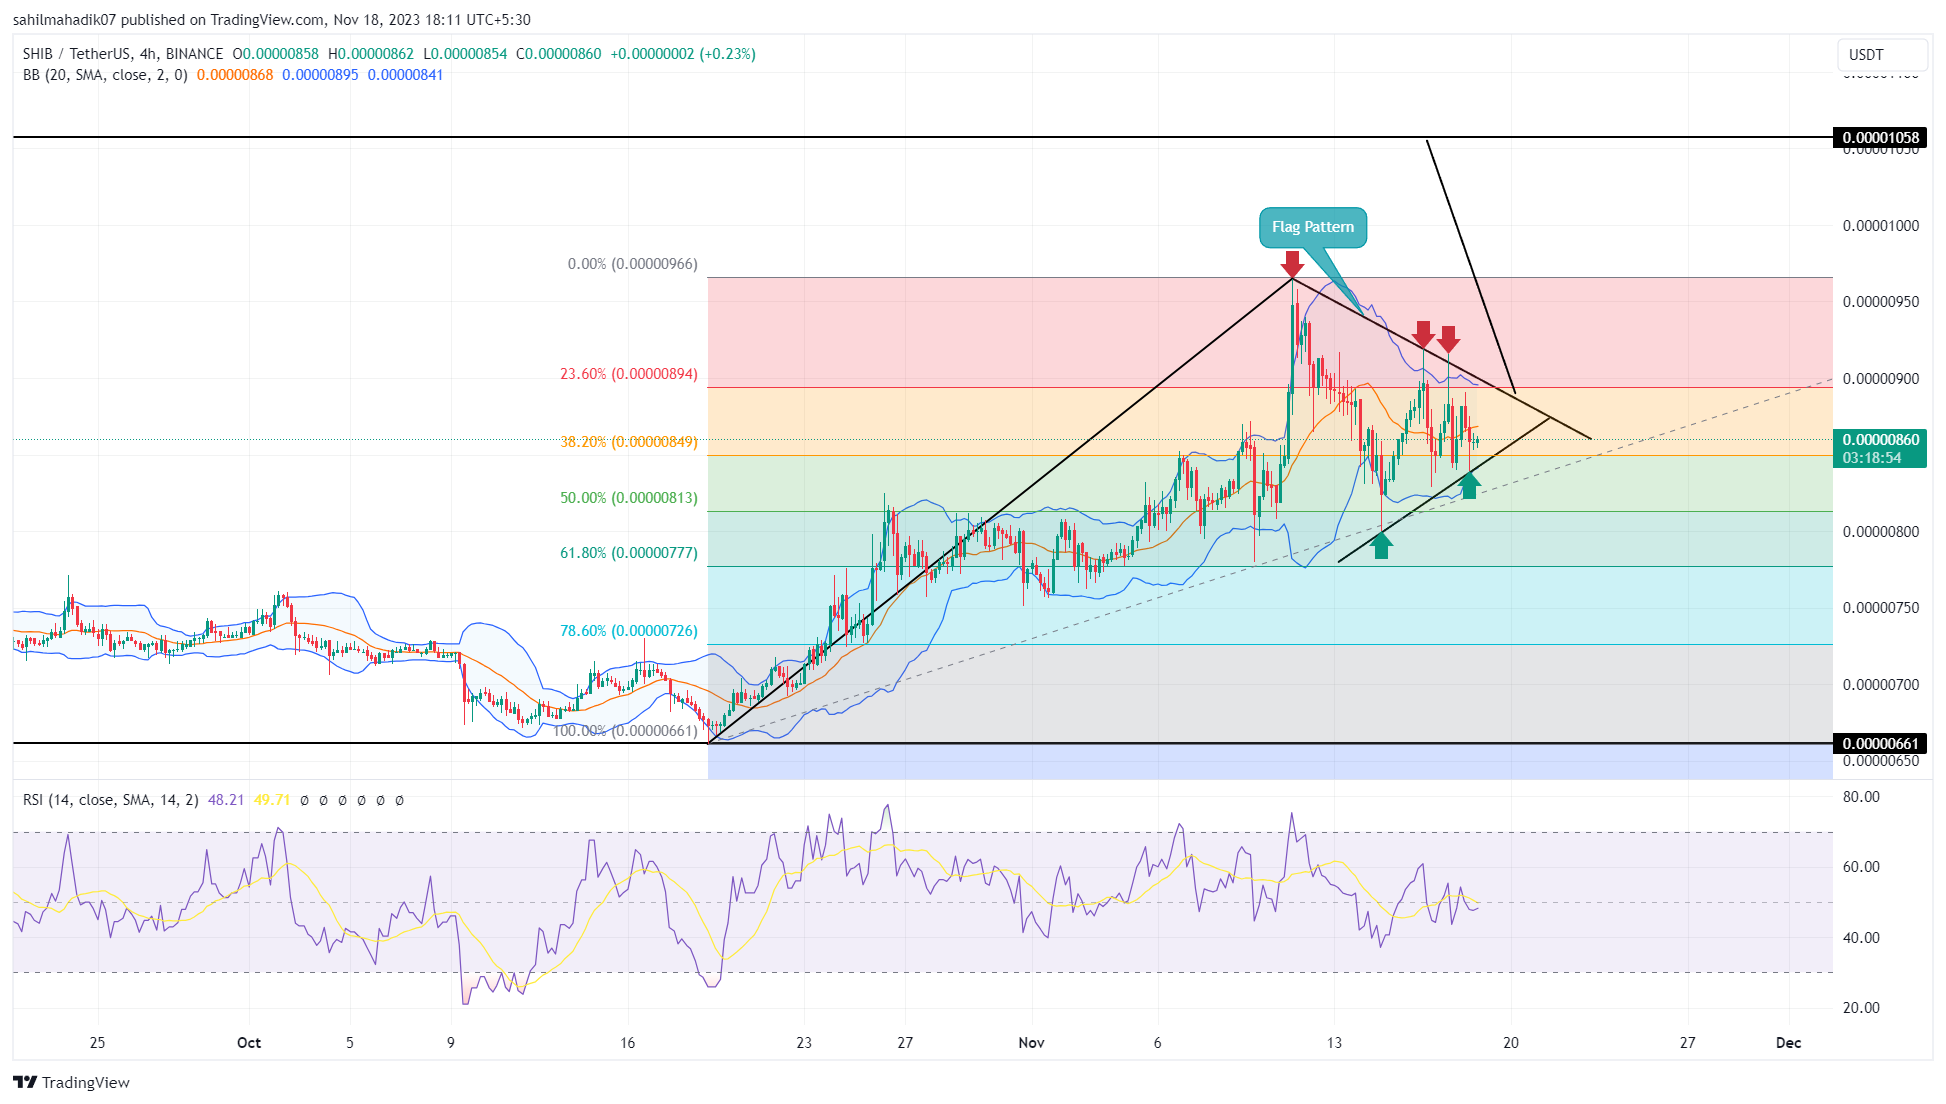
This led to a temporary pullback, reaching a level of $0.000008, which corresponds to the 50% Fibonacci retracement level. In the context of a long-term bull run, this pullback is generally seen as a healthy correction.
これにより一時的な下落が起こり、50%のフィボナッチリトレースメントレベルに相当する0.000008ドルのレベルに達しました。長期的な強気相場の文脈では、この下落は一般に健全な調整とみなされます。
When examining the 4-hour timeframe chart, it can be observed that this consolidation phase has formed a continuation pattern known as a “flag.” Typically, this formation involves a brief period of horizontal movement before a definitive upward breakout. If SHIB breaks above the upper trend line of this flag formation, it could potentially target $0.0000150 as the initial price objective, representing an 18% potential gain.
4時間足チャートを調べると、この保ち合いフェーズが「フラグ」として知られる継続パターンを形成していることがわかります。通常、このフォーメーションには、決定的な上向きブレイクアウトの前に、短期間の水平方向の動きが含まれます。 SHIBがこのフラグ形成の上部トレンドラインを上抜けた場合、初値目標として0.0000150ドルを目標とする可能性があり、これは18%の潜在的な利益を表します。
Comparison of SHIB and DOGE Performance
SHIBとDOGEのパフォーマンスの比較
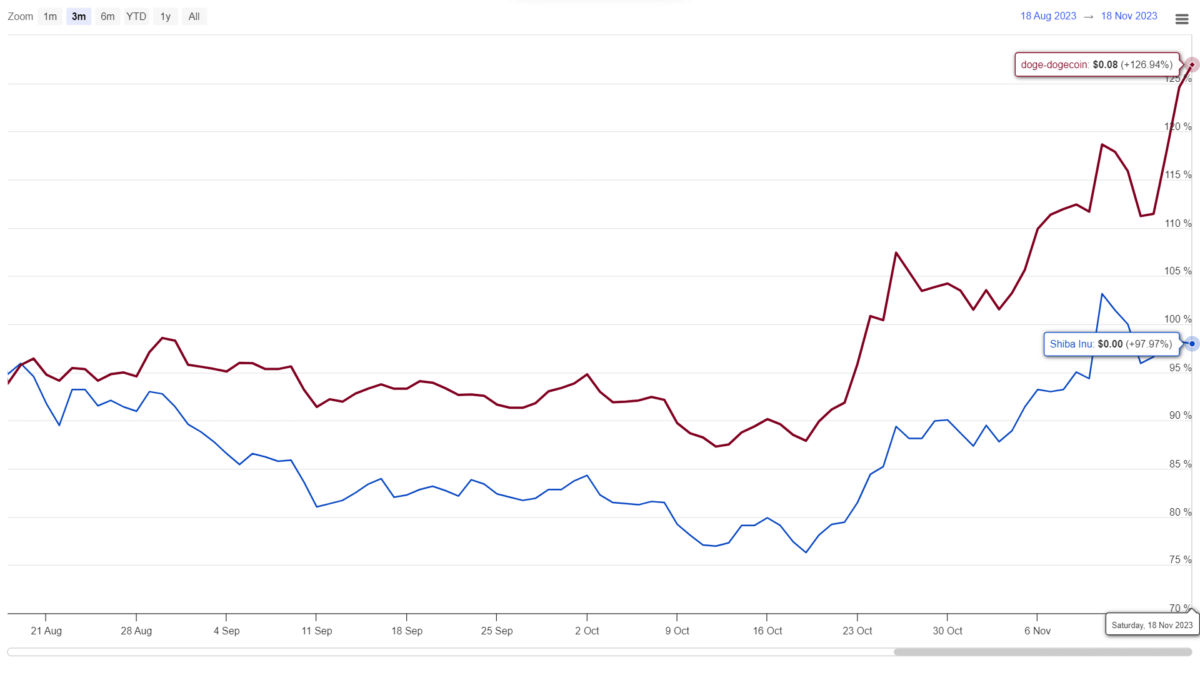
When comparing the price behavior of SHIB with its main competitor, Dogecoin (DOGE), over the past three months, it can be seen that DOGE has shown stronger momentum, consistently forming new highs and lows. On the other hand, SHIB is struggling to surpass the $0.00000969 level. Considering the prevailing bullish trend in the market, Dogecoin may offer more favorable opportunities for long positions.
過去 3 か月間の SHIB の価格動向を主な競合他社であるドージコイン (DOGE) と比較すると、DOGE がより強い勢いを示し、常に新たな高値と安値を形成していることがわかります。一方、SHIBは0.00000969ドルのレベルを超えるのに苦労しています。市場に蔓延している強気傾向を考慮すると、ドージコインはロングポジションにとってより有利な機会を提供する可能性があります。
Meanwhile, SHIB is forming declining lows on the daily timeframe’s Relative Strength Index (RSI), indicating selling pressure. However, the ongoing upward trend in SHIB’s price suggests a higher probability of further upward movement. The converging Bollinger Bands (BB) along with RSI indicate that the market is currently in a typical correction phase before a potential breakout or continuation of the trend.
一方、SHIBは日足の時間枠の相対力指数(RSI)で下降安値を形成しており、売り圧力を示している。しかし、SHIB価格の継続的な上昇傾向は、さらなる上昇の可能性が高いことを示唆しています。収束するボリンジャー バンド (BB) と RSI は、市場が現在、潜在的なブレイクアウトまたはトレンド継続の前の典型的な調整段階にあることを示しています。
Continue Reading: https://en.coin-turk.com/shiba-inu-price-analysis-can-shib-break-the-0-00001-barrier/続きを読む: https://en.coin-turk.com/shiba-inu-price-analysis-can-shib-break-the-0-00001-barrier/


 CoinoMedia
 Optimisus
 CFN
CFN CFN
CFN The Crypto Times
 Cryptopolitan_News
 Crypto News Land
 CryptoNewsLand
 CoinPedia News


