A technical overlook of XRP's price movement illustrates this struggle, as recent trends signal potential headwinds for this digital asset.
Una mirada técnica al movimiento de precios de XRP ilustra esta lucha, ya que las tendencias recientes indican posibles obstáculos para este activo digital.
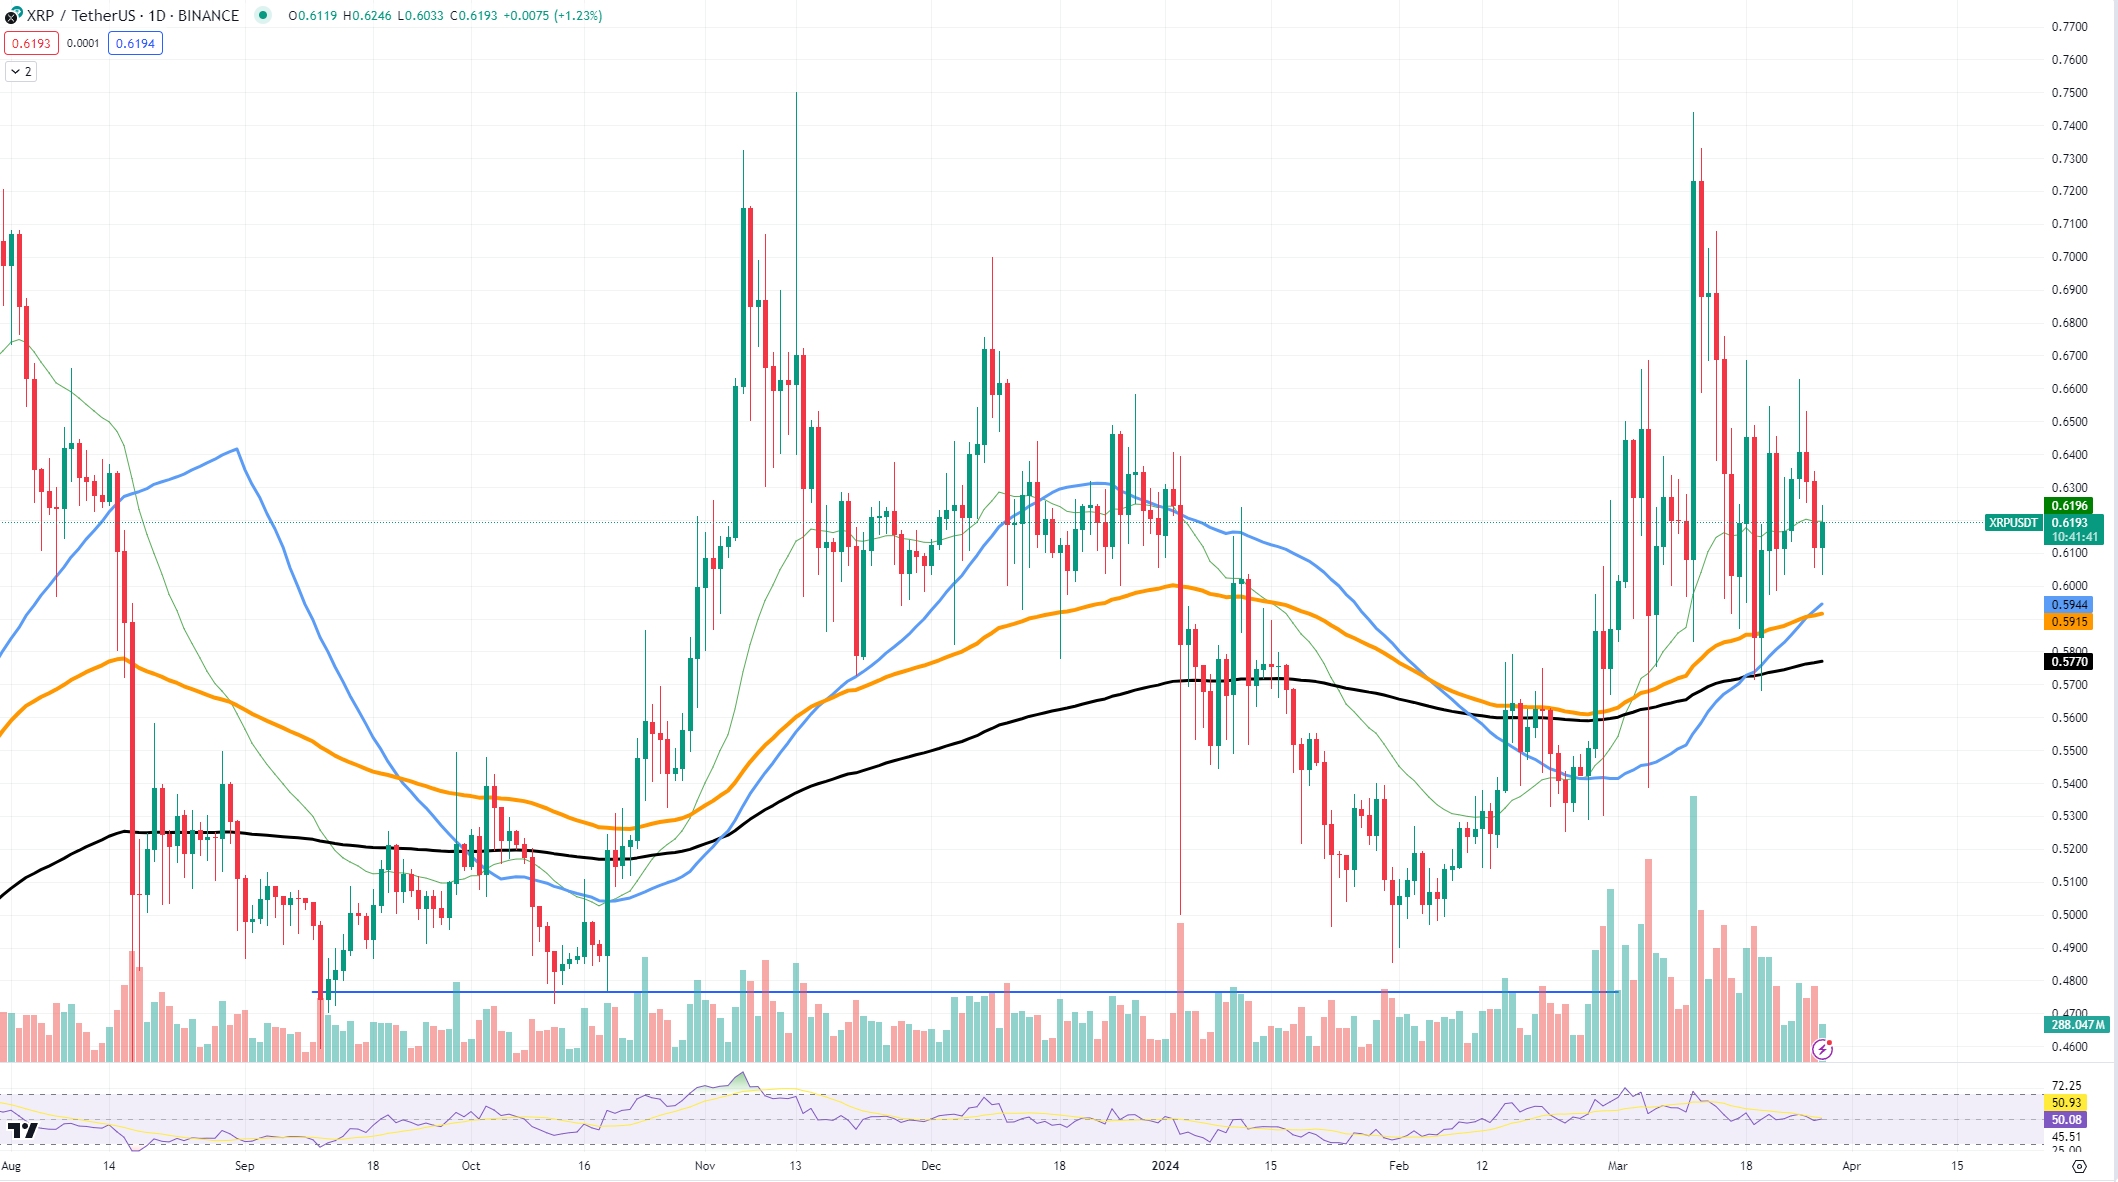
The chart demonstrates that XRP is navigating a delicate position. The asset has recently veered away from the higher moving average lines, indicating bearish sentiment among traders. These moving averages serve as layered resistance, with the 50-day moving average positioned as immediate resistance, followed by the 100-day and 200-day moving averages as further barriers to price growth.
El gráfico demuestra que XRP se encuentra en una posición delicada. El activo se ha alejado recientemente de las líneas de media móvil más altas, lo que indica un sentimiento bajista entre los operadores. Estos promedios móviles sirven como resistencia en capas, con el promedio móvil de 50 días posicionado como resistencia inmediata, seguido por los promedios móviles de 100 y 200 días como barreras adicionales al crecimiento de los precios.
 XRP/USDT Chart by TradingView
Gráfico XRP/USDT de TradingView
At the moment, XRP moves near a significant support level around $0.57, a point at which buying interest has historically emerged. The next critical support lies near the $0.50 threshold, a psychological threshold that acts as support thanks to the "round number" phenomenon. XRP's move past its moving averages could see resistance levels at $0.63 and the more formidable $0.70 come into play.
Por el momento, XRP se mueve cerca de un nivel de soporte significativo de alrededor de 0,57 dólares, un punto en el que históricamente ha surgido interés de compra. El siguiente soporte crítico se encuentra cerca del umbral de 0,50 dólares, un umbral psicológico que actúa como soporte gracias al fenómeno del "número redondo". El movimiento de XRP más allá de sus promedios móviles podría hacer que entren en juego niveles de resistencia de $0,63 y los más formidables $0,70.
Unfortunately, XRP is not really following market trends and has been showing suppressed dynamics rather than growth similar to what we have seen on Dogecoin.
Desafortunadamente, XRP no sigue realmente las tendencias del mercado y ha mostrado una dinámica suprimida en lugar de un crecimiento similar al que hemos visto en Dogecoin.
Dogecoin gains serious strength
Dogecoin gana gran fuerza
DOGE is seeing an explosive rise in its price, reaching up to $0.2184. Such an explosive price surge is a result of a prolonged reversal, with a flattened-out bottom. The pattern usually emerges on assets that have been trading sideways for a considerable amount of time.
DOGE está experimentando un aumento explosivo en su precio, alcanzando hasta 0,2184 dólares. Un aumento tan explosivo de los precios es el resultado de una reversión prolongada, con un fondo aplanado. El patrón suele surgir en activos que se han estado negociando lateralmente durante un período de tiempo considerable.
A closer look at the price chart reveals that DOGE has found strong support at $0.1599, a level that previously saw the asset bounce back after a downward trend. On the upside, resistance can be spotted around the recent high of $0.2184.
Una mirada más cercana al gráfico de precios revela que DOGE ha encontrado un fuerte soporte en $ 0,1599, un nivel en el que anteriormente el activo se recuperó después de una tendencia a la baja. Por el lado positivo, se puede observar resistencia alrededor del máximo reciente de 0,2184 dólares.
If DOGE can break through this top level, the price might climb even more. However, if the upward push loses strength, the $0.1599 support is key to keeping investors' positive views on the coin.
Si DOGE puede superar este nivel máximo, el precio podría subir aún más. Sin embargo, si el impulso alcista pierde fuerza, el soporte de 0,1599 dólares es clave para mantener las opiniones positivas de los inversores sobre la moneda.
For the future, if Dogecoin stays above the average lines shown in orange (50-day), blue (100-day) and black (200-day) on the chart, it could mean the upward trend is getting stronger. This would help DOGE not just as a meme coin, but as a solid option in the larger crypto world.
Para el futuro, si Dogecoin se mantiene por encima de las líneas promedio que se muestran en naranja (50 días), azul (100 días) y negro (200 días) en el gráfico, podría significar que la tendencia alcista se está fortaleciendo. Esto ayudaría a DOGE no solo como una moneda meme, sino como una opción sólida en el mundo criptográfico en general.
In terms of the future, growth potential certainly exists. The breakthrough could indicate a strong continuation of the current trend, given increasing demand and positive sentiment among investors. However, Dogecoin's main fuel is community and social media hype, rather than fundamentals and technical strength.
En términos de futuro, ciertamente existe potencial de crecimiento. El avance podría indicar una fuerte continuación de la tendencia actual, dada la creciente demanda y el sentimiento positivo entre los inversores. Sin embargo, el principal combustible de Dogecoin es la exageración de la comunidad y las redes sociales, más que los fundamentos y la fortaleza técnica.
Solana gets squeezed
Solana es exprimida
When you look at SOL's chart, you can see the symmetrical triangle. It is made by lines that come together and sort of squeeze the price between ascending and descending trendlines. This means that people buying and selling SOL are evening out, and the price is not changing as much.
Cuando miras el gráfico de SOL, puedes ver el triángulo simétrico. Está formado por líneas que se juntan y en cierto modo comprimen el precio entre líneas de tendencia ascendentes y descendentes. Esto significa que las personas que compran y venden SOL se están igualando y el precio no cambia tanto.
Right now, SOL's price is about $183.74, and it is getting to the pointy end of the triangle. This spot is very important because we expect the price to break out from here.
En este momento, el precio de SOL es de aproximadamente 183,74 dólares y está llegando al extremo puntiagudo del triángulo. Este punto es muy importante porque esperamos que el precio suba desde aquí.
The price has support at around $167.11, where people have bought SOL before to make its price go up. If the price of Solana goes below this, it might drop to around $139.84, but this could also be where it stops falling.
El precio tiene soporte en alrededor de $ 167,11, donde la gente ha comprado SOL antes para hacer subir su precio. Si el precio de Solana cae por debajo de esto, podría caer a alrededor de 139,84 dólares, pero aquí también podría ser donde deje de caer.
The triangle pattern does not tell us if the price will go up or down for sure, so staying cautious as advised. If the price breaks out and goes up, it shows that people really want SOL and think positively about it.
El patrón de triángulo no nos dice si el precio subirá o bajará con seguridad, por lo que debemos ser cautelosos como se recomienda. Si el precio se dispara y sube, demuestra que la gente realmente quiere SOL y piensa positivamente al respecto.


 DogeHome
 The Bit Journal
 BlockchainReporter
 Optimisus
 CFN
CFN Coincu
 Cryptopolitan_News


