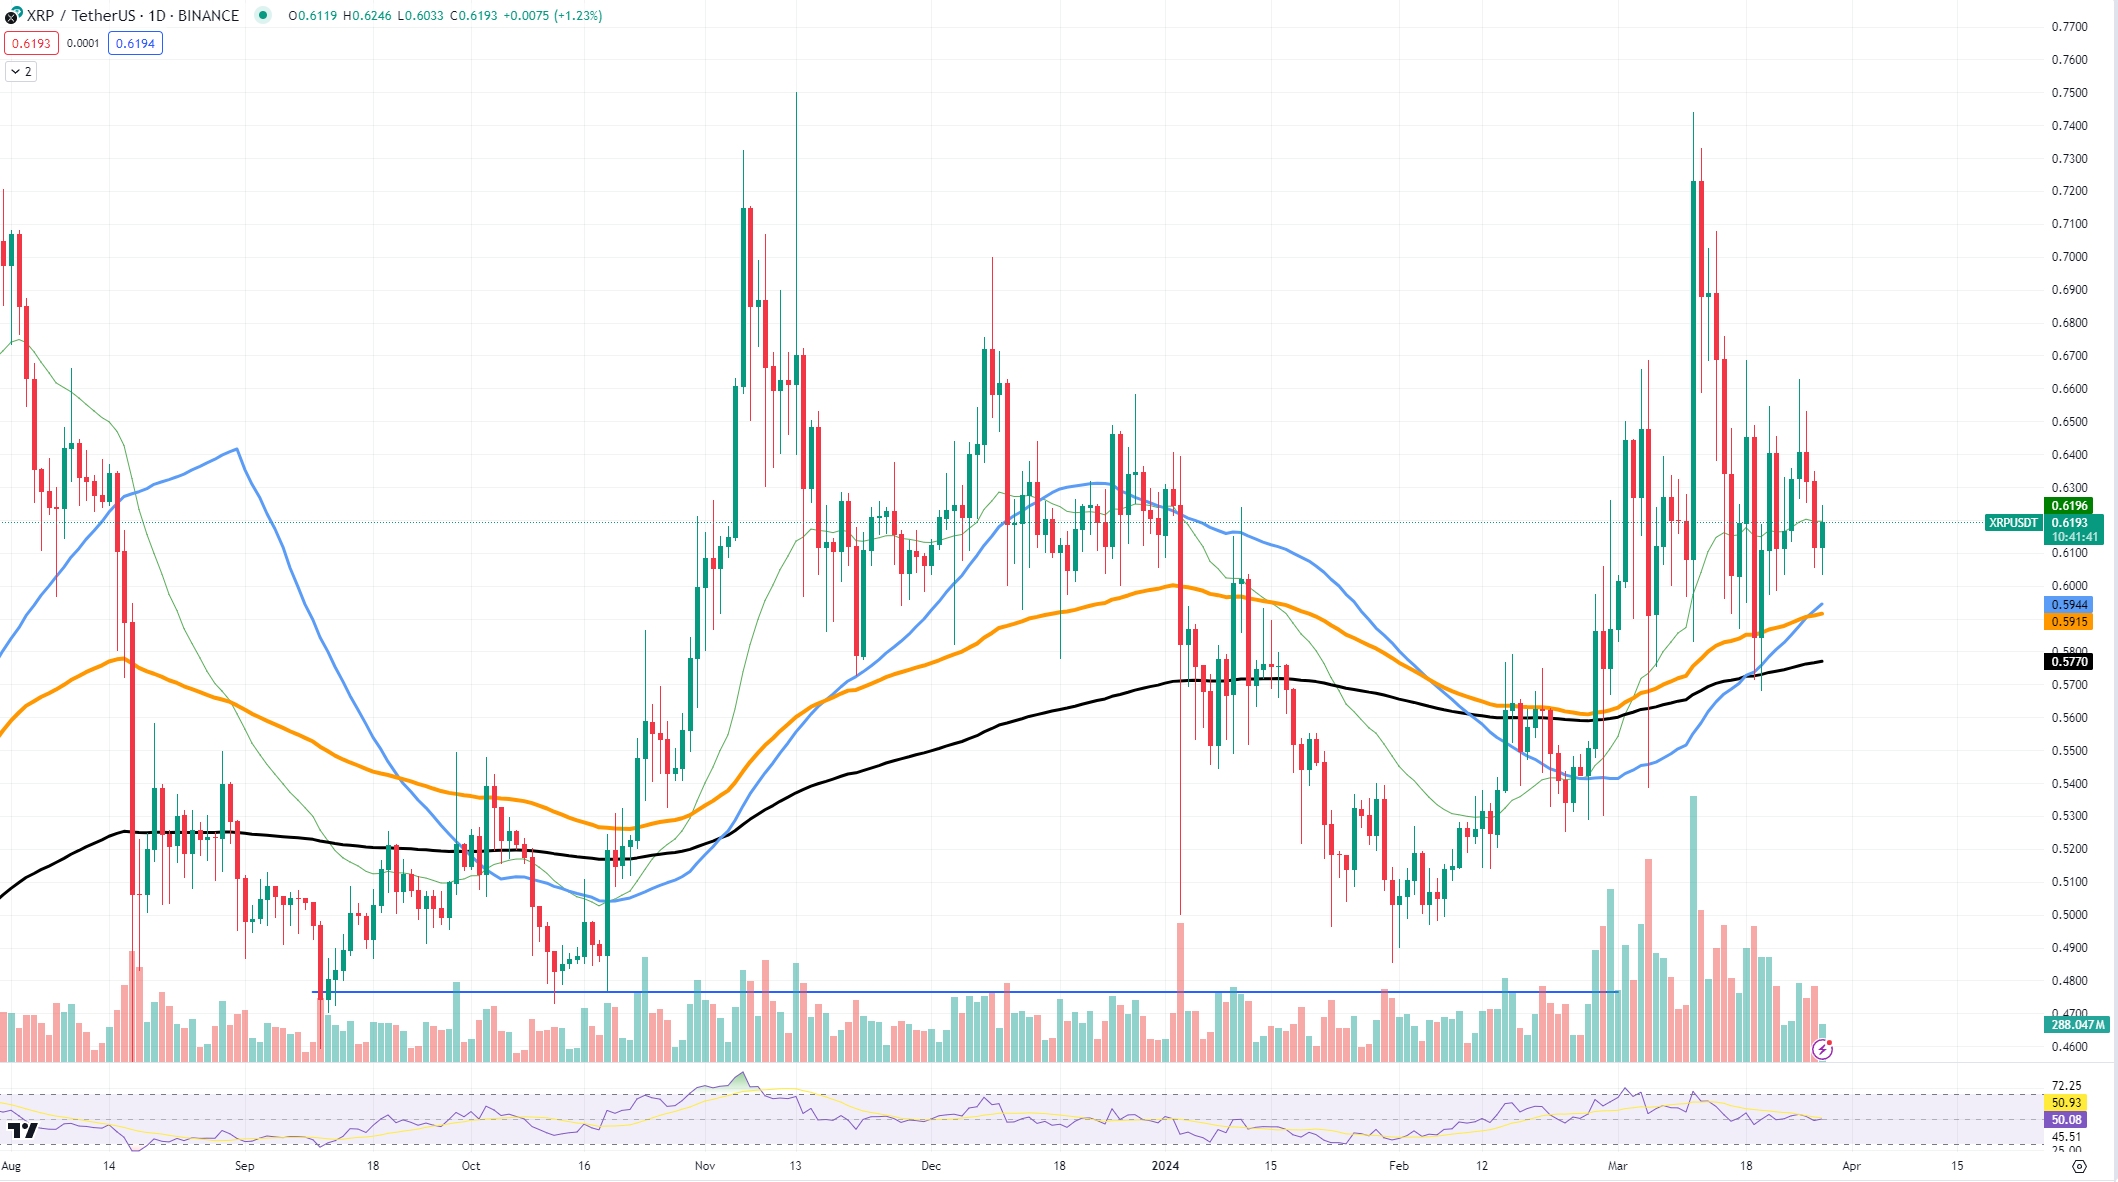
A technical overlook of XRP's price movement illustrates this struggle, as recent trends signal potential headwinds for this digital asset.
对 XRP 价格走势的技术忽视说明了这种困境,因为最近的趋势预示着这种数字资产的潜在阻力。
The chart demonstrates that XRP is navigating a delicate position. The asset has recently veered away from the higher moving average lines, indicating bearish sentiment among traders. These moving averages serve as layered resistance, with the 50-day moving average positioned as immediate resistance, followed by the 100-day and 200-day moving averages as further barriers to price growth.
该图表表明 XRP 正处于一个微妙的位置。该资产最近偏离了较高的移动平均线,表明交易者的看跌情绪。这些移动平均线充当分层阻力,其中 50 日移动平均线定位为直接阻力,其次是 100 日和 200 日移动平均线作为价格上涨的进一步障碍。
 XRP/USDT Chart by TradingView
XRP/USDT 图表(TradingView)
At the moment, XRP moves near a significant support level around $0.57, a point at which buying interest has historically emerged. The next critical support lies near the $0.50 threshold, a psychological threshold that acts as support thanks to the "round number" phenomenon. XRP's move past its moving averages could see resistance levels at $0.63 and the more formidable $0.70 come into play.
目前,XRP 接近 0.57 美元左右的重要支撑位,这是历史上出现购买兴趣的点。下一个关键支撑位于 0.50 美元门槛附近,这是一个心理门槛,由于“整数”现象而起到支撑作用。 XRP 突破移动平均线可能会看到阻力位 0.63 美元,而更强大的 0.70 美元就会发挥作用。
Unfortunately, XRP is not really following market trends and has been showing suppressed dynamics rather than growth similar to what we have seen on Dogecoin.
不幸的是,XRP 并没有真正遵循市场趋势,并且一直表现出受抑制的动态,而不是类似于我们在狗狗币上看到的增长。
Dogecoin gains serious strength
狗狗币实力强劲
DOGE is seeing an explosive rise in its price, reaching up to $0.2184. Such an explosive price surge is a result of a prolonged reversal, with a flattened-out bottom. The pattern usually emerges on assets that have been trading sideways for a considerable amount of time.
DOGE 的价格出现爆炸式上涨,最高达到 0.2184 美元。如此爆炸性的价格飙升是长期反转和底部平坦的结果。这种模式通常出现在已经横盘交易相当长一段时间的资产上。
A closer look at the price chart reveals that DOGE has found strong support at $0.1599, a level that previously saw the asset bounce back after a downward trend. On the upside, resistance can be spotted around the recent high of $0.2184.
仔细观察价格图表可以发现,DOGE 在 0.1599 美元找到了强劲支撑,此前该资产在下跌趋势后出现反弹。从好的方面来说,可以在近期高点 0.2184 美元附近发现阻力。
If DOGE can break through this top level, the price might climb even more. However, if the upward push loses strength, the $0.1599 support is key to keeping investors' positive views on the coin.
如果DOGE能够突破这个最高水平,价格可能会进一步上涨。然而,如果上行动力减弱,0.1599 美元的支撑位是保持投资者对代币积极看法的关键。
For the future, if Dogecoin stays above the average lines shown in orange (50-day), blue (100-day) and black (200-day) on the chart, it could mean the upward trend is getting stronger. This would help DOGE not just as a meme coin, but as a solid option in the larger crypto world.
对于未来,如果狗狗币保持在图表上橙色(50 天)、蓝色(100 天)和黑色(200 天)显示的平均线上方,则可能意味着上升趋势正在变得更强。这不仅有助于 DOGE 作为一种模因币,而且可以作为更大的加密世界中的可靠选择。
In terms of the future, growth potential certainly exists. The breakthrough could indicate a strong continuation of the current trend, given increasing demand and positive sentiment among investors. However, Dogecoin's main fuel is community and social media hype, rather than fundamentals and technical strength.
就未来而言,增长潜力肯定存在。鉴于需求增加和投资者的积极情绪,这一突破可能表明当前趋势将强劲延续。然而,狗狗币的主要动力是社区和社交媒体的炒作,而不是基本面和技术实力。
Solana gets squeezed
索拉纳被挤压
When you look at SOL's chart, you can see the symmetrical triangle. It is made by lines that come together and sort of squeeze the price between ascending and descending trendlines. This means that people buying and selling SOL are evening out, and the price is not changing as much.
当您查看 SOL 的图表时,您可以看到对称三角形。它是由汇集在一起并在上升和下降趋势线之间挤压价格的线条组成的。这意味着买卖 SOL 的人都在平仓,而且价格变化不大。
Right now, SOL's price is about $183.74, and it is getting to the pointy end of the triangle. This spot is very important because we expect the price to break out from here.
目前,SOL 的价格约为 183.74 美元,正接近三角形的尖端。这个点非常重要,因为我们预计价格将从这里突破。
The price has support at around $167.11, where people have bought SOL before to make its price go up. If the price of Solana goes below this, it might drop to around $139.84, but this could also be where it stops falling.
价格在 167.11 美元附近有支撑,人们之前曾在此购买 SOL 以使其价格上涨。如果 Solana 的价格跌破此水平,可能会跌至 139.84 美元左右,但这也可能是其停止下跌的地方。
The triangle pattern does not tell us if the price will go up or down for sure, so staying cautious as advised. If the price breaks out and goes up, it shows that people really want SOL and think positively about it.
三角形形态并不能告诉我们价格肯定会上涨还是下跌,因此请按照建议保持谨慎。如果价格突破并上涨,则表明人们确实想要 SOL 并且对此持积极态度。


 Thecryptoupdates
 DogeHome
 The Crypto Times
 Coincu
 Optimisus
 Coin_Gabbar
 Optimisus


