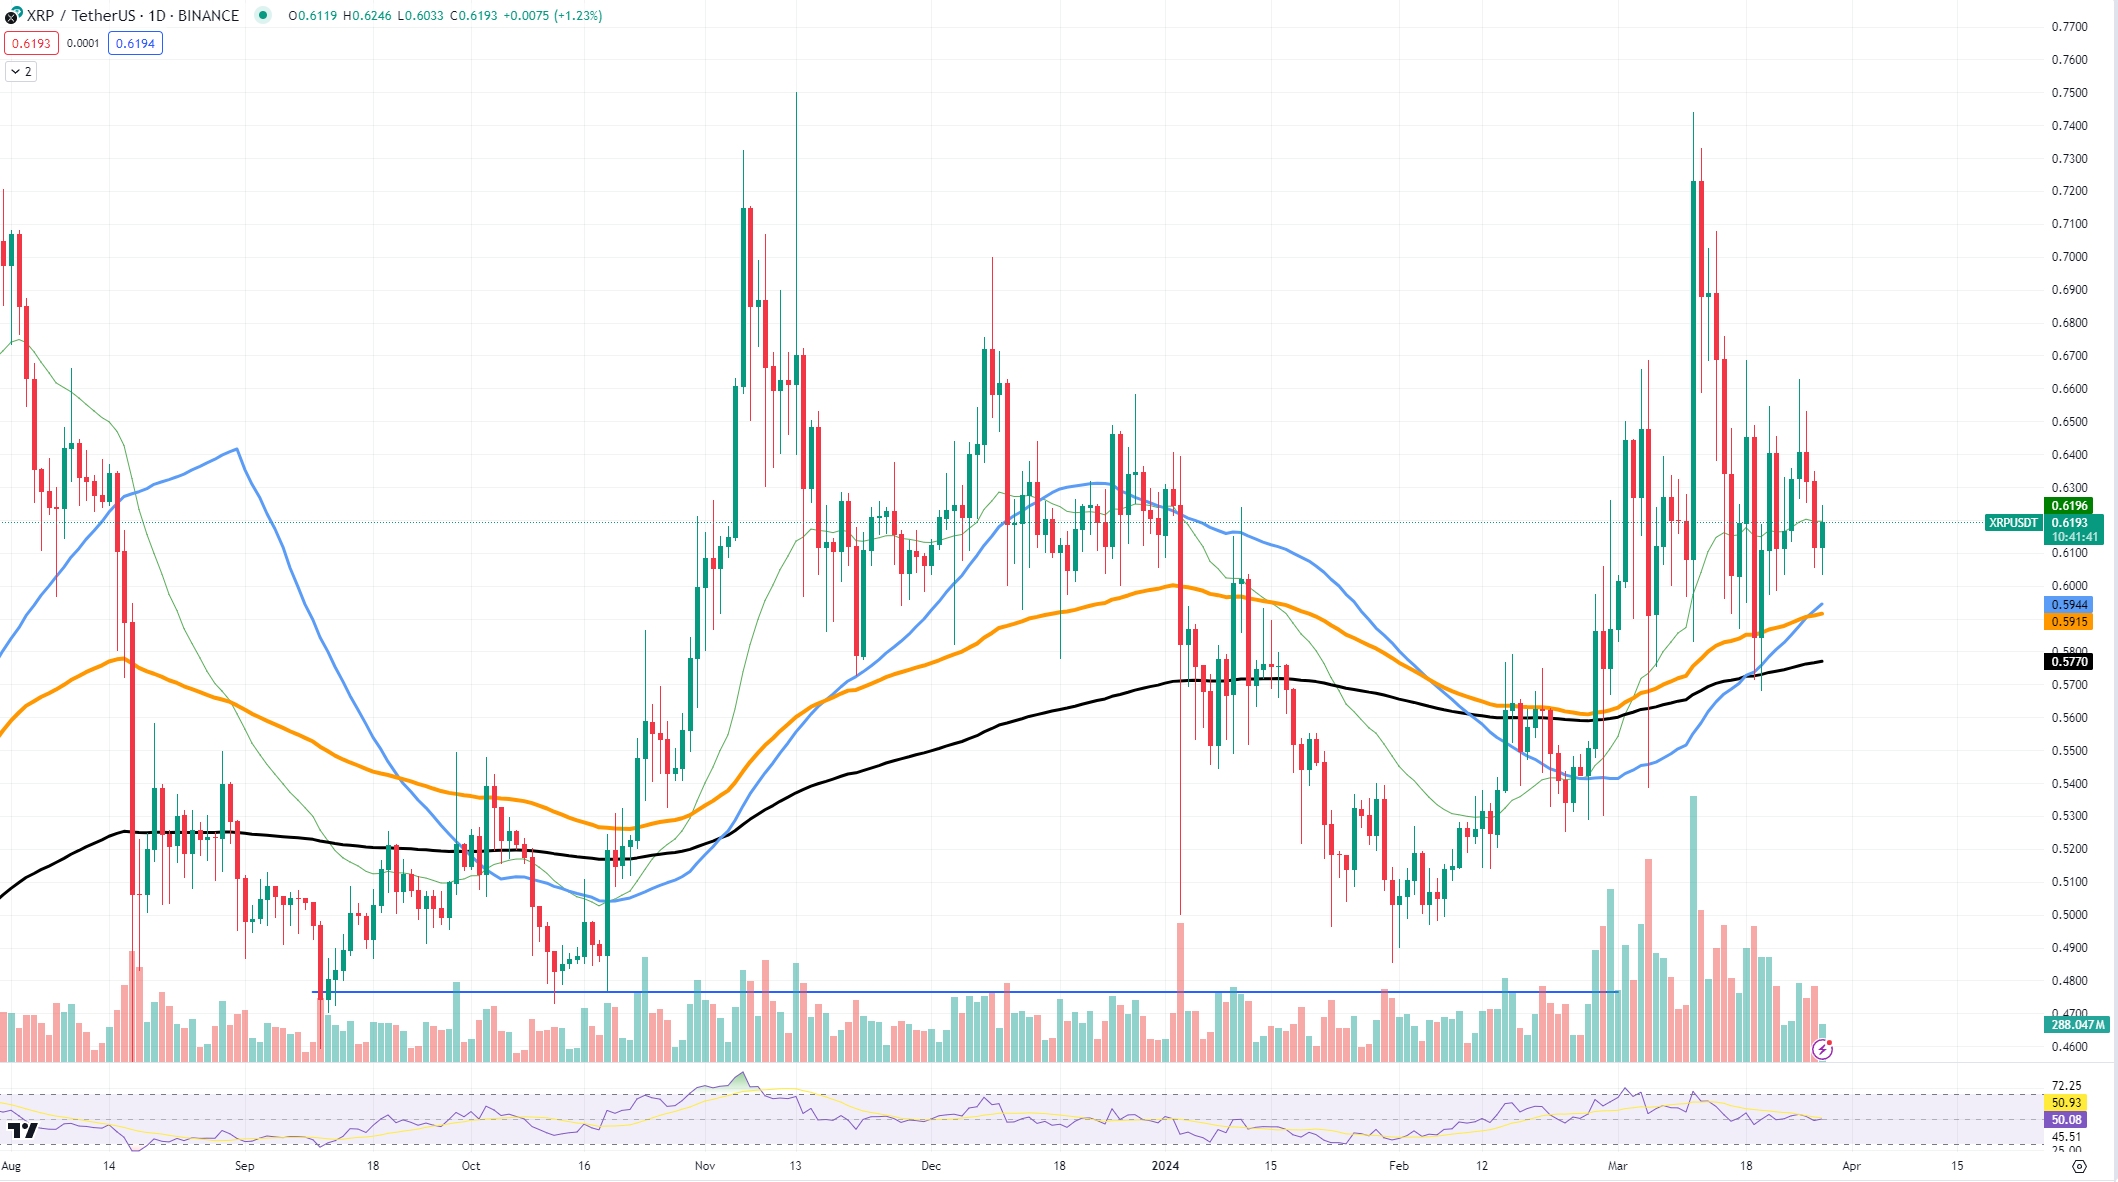
A technical overlook of XRP's price movement illustrates this struggle, as recent trends signal potential headwinds for this digital asset.
最近の傾向がこのデジタル資産に対する潜在的な逆風を示唆しているため、XRPの価格変動の技術的な見落としはこの苦戦を示しています。
The chart demonstrates that XRP is navigating a delicate position. The asset has recently veered away from the higher moving average lines, indicating bearish sentiment among traders. These moving averages serve as layered resistance, with the 50-day moving average positioned as immediate resistance, followed by the 100-day and 200-day moving averages as further barriers to price growth.
このチャートは、XRPが微妙な位置を航行していることを示しています。この資産は最近、より高い移動平均線から逸れており、トレーダー間の弱気なセンチメントを示しています。これらの移動平均は層状の抵抗線として機能し、50 日移動平均が当面の抵抗線として位置付けられ、その後に 100 日移動平均線と 200 日移動平均線が価格上昇に対するさらなる障壁として配置されます。
 XRP/USDT Chart by TradingView
TradingViewによるXRP/USDTチャート
At the moment, XRP moves near a significant support level around $0.57, a point at which buying interest has historically emerged. The next critical support lies near the $0.50 threshold, a psychological threshold that acts as support thanks to the "round number" phenomenon. XRP's move past its moving averages could see resistance levels at $0.63 and the more formidable $0.70 come into play.
現時点で、XRPは0.57ドル付近の重要なサポートレベル付近で推移しており、歴史的にこのポイントに買いの関心が浮上している。次の重要なサポートは、「ラウンドナンバー」現象のおかげでサポートとして機能する心理的閾値である0.50ドルの閾値付近にあります。 XRPが移動平均線を超えると、0.63ドルが抵抗線となり、さらに手強い0.70ドルが登場する可能性がある。
Unfortunately, XRP is not really following market trends and has been showing suppressed dynamics rather than growth similar to what we have seen on Dogecoin.
残念ながら、XRPは市場のトレンドを実際には追随しておらず、ドージコインで見られたような成長ではなく、抑制されたダイナミクスを示しています。
Dogecoin gains serious strength
ドージコインが大幅に強まる
DOGE is seeing an explosive rise in its price, reaching up to $0.2184. Such an explosive price surge is a result of a prolonged reversal, with a flattened-out bottom. The pattern usually emerges on assets that have been trading sideways for a considerable amount of time.
DOGEは価格が爆発的に上昇し、最大0.2184ドルに達している。このような爆発的な価格高騰は、底が平らになった長期にわたる反転の結果です。このパターンは通常、かなりの期間横ばいで取引されている資産に現れます。
A closer look at the price chart reveals that DOGE has found strong support at $0.1599, a level that previously saw the asset bounce back after a downward trend. On the upside, resistance can be spotted around the recent high of $0.2184.
価格チャートを詳しく見ると、DOGEが0.1599ドルに強力なサポートを見つけていることがわかります。これは、以前は資産が下降傾向の後に反発したレベルです。上値では、最近の高値である0.2184米ドル付近に抵抗線が見られる。
If DOGE can break through this top level, the price might climb even more. However, if the upward push loses strength, the $0.1599 support is key to keeping investors' positive views on the coin.
DOGEがこの最高値を突破できれば、価格はさらに上昇する可能性があります。しかし、上昇の勢いが弱まった場合、0.1599ドルのサポートが投資家の同コインに対する前向きな見方を維持する鍵となる。
For the future, if Dogecoin stays above the average lines shown in orange (50-day), blue (100-day) and black (200-day) on the chart, it could mean the upward trend is getting stronger. This would help DOGE not just as a meme coin, but as a solid option in the larger crypto world.
将来的には、ドージコインがチャート上のオレンジ色(50日)、青(100日)、黒(200日)で示された平均線を上回っている場合、それは上昇傾向が強まっていることを意味する可能性があります。これは、DOGE をミームコインとしてだけでなく、より大きな暗号通貨の世界における確かな選択肢として支援するでしょう。
In terms of the future, growth potential certainly exists. The breakthrough could indicate a strong continuation of the current trend, given increasing demand and positive sentiment among investors. However, Dogecoin's main fuel is community and social media hype, rather than fundamentals and technical strength.
将来的には、成長の可能性は確実に存在します。需要の高まりと投資家の前向きなセンチメントを考慮すると、この躍進は現在の傾向が強力に継続していることを示す可能性があります。しかし、ドージコインの主な燃料は、ファンダメンタルズや技術力ではなく、コミュニティとソーシャルメディアの誇大宣伝です。
Solana gets squeezed
ソラナ 取得 圧迫
When you look at SOL's chart, you can see the symmetrical triangle. It is made by lines that come together and sort of squeeze the price between ascending and descending trendlines. This means that people buying and selling SOL are evening out, and the price is not changing as much.
SOLのチャートを見ると、対称的な三角形が見られます。ラインが集まって、上昇トレンドラインと下降トレンドラインの間で価格を圧迫するような形で形成されます。これは、SOLを売買する人々が均等化し、価格がそれほど変化していないことを意味します。
Right now, SOL's price is about $183.74, and it is getting to the pointy end of the triangle. This spot is very important because we expect the price to break out from here.
現在、SOLの価格は約183.74ドルで、三角形の先端に近づいています。ここから価格がブレイクすると予想されるため、このスポットは非常に重要です。
The price has support at around $167.11, where people have bought SOL before to make its price go up. If the price of Solana goes below this, it might drop to around $139.84, but this could also be where it stops falling.
価格は167.11ドル付近にサポートがあり、価格を上昇させるために人々が以前にSOLを購入したことがある。ソラナの価格がこれを下回れば、139.84ドル付近まで下落する可能性があるが、ここで下落が止まる可能性もある。
The triangle pattern does not tell us if the price will go up or down for sure, so staying cautious as advised. If the price breaks out and goes up, it shows that people really want SOL and think positively about it.
トライアングル パターンからは価格が確実に上がるか下がるかはわかりません。そのため、アドバイスに従って慎重に行動してください。価格がブレイクして上昇する場合、それは人々が本当にSOLを望んでおり、それについて前向きに考えていることを示しています。


 Optimisus
 Optimisus
 Optimisus
 Thecryptoupdates
 DogeHome
 The Crypto Times
 Coincu
 Optimisus
 Coin_Gabbar


