Bearish Market Sentiment Persists in Cryptocurrency, but Certain Assets Defy Trend
Le sentiment baissier du marché persiste dans les crypto-monnaies, mais certains actifs défient la tendance
The bearish sentiment that has gripped the cryptocurrency market throughout June continued last week, with Bitcoin (BTC) falling below $59,000 for the first time in eight weeks, triggering widespread losses across the market.
Le sentiment baissier qui a saisi le marché des cryptomonnaies tout au long du mois de juin s'est poursuivi la semaine dernière, le Bitcoin (BTC) tombant en dessous de 59 000 dollars pour la première fois en huit semaines, déclenchant des pertes généralisées sur le marché.
However, amidst the market downturn, a few assets bucked the trend, recording new all-time highs. Selective bullishness proved insufficient to prevent the overall crypto market cap from declining by 4.6% to $2.24 trillion.
Cependant, au milieu du ralentissement du marché, quelques actifs ont résisté à la tendance, enregistrant de nouveaux sommets historiques. Une tendance haussière sélective s’est avérée insuffisante pour empêcher la capitalisation boursière globale de la cryptographie de diminuer de 4,6 % pour atteindre 2,24 billions de dollars.
Based on their strong performances last week, the following cryptocurrencies warrant attention this week:
Sur la base de leurs solides performances de la semaine dernière, les crypto-monnaies suivantes méritent l’attention cette semaine :
MOG: New All-Time High and Overbought
MOG : nouveau sommet historique et surachat
MOG Coin (MOG) enjoyed a bullish week, starting with a decline but rebounding sharply on June 24th and 25th due to increased social volume. It reached a new all-time high of $0.00002123 on June 29th, driven by growing interest. MOG closed the week at $0.000018355, with a 67% gain. However, its Commodity Channel Index (CCI) suggests it is overbought, indicating a potential pullback.
MOG Coin (MOG) a connu une semaine haussière, commençant par une baisse mais rebondissant fortement les 24 et 25 juin en raison de l'augmentation du volume social. Il a atteint un nouveau sommet historique de 0,00002123 $ le 29 juin, porté par un intérêt croissant. MOG a clôturé la semaine à 0,000018355 $, avec un gain de 67 %. Cependant, son Commodity Channel Index (CCI) suggère qu’il est suracheté, indiquant un repli potentiel.
Kaspa: Enters Price Discovery After Breaking ATH
Kaspa : entre dans la découverte des prix après avoir cassé l'ATH
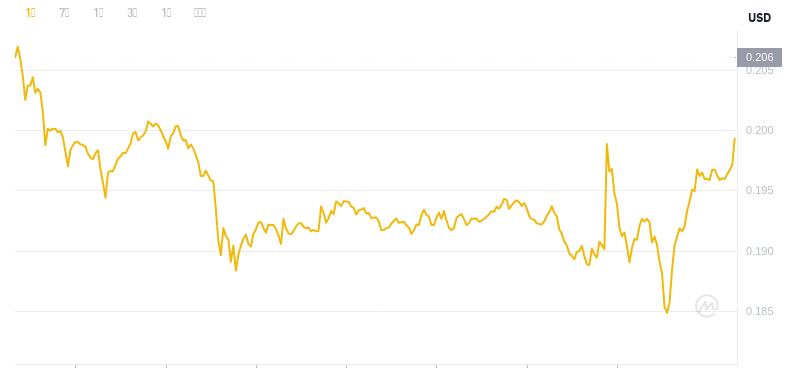
Kaspa (KAS) also saw an uptrend last week, reaching a new all-time high of $0.1939 on June 30th. This rally was partly attributed to reports of Marathon Digital mining $16 million in KAS. Kaspa continued to reach new record prices, entering the new week with an 8.96% increase over the past 24 hours. However, its relative strength index (RSI) has entered overbought territories, suggesting a possible retracement.
Kaspa (KAS) a également connu une tendance à la hausse la semaine dernière, atteignant un nouveau sommet historique de 0,1939 $ le 30 juin. Ce rallye a été en partie attribué aux informations selon lesquelles Marathon Digital extrayait 16 millions de dollars en KAS. Kaspa a continué d'atteindre de nouveaux prix records, entamant la nouvelle semaine avec une augmentation de 8,96 % au cours des dernières 24 heures. Cependant, son indice de force relative (RSI) est entré dans des territoires de surachat, suggérant un possible retracement.
FET: Rebounding After Steep Decline
FET : rebond après un fort déclin
Fetch.ai (FET) initially experienced bullish momentum, rising 26% from June 23rd to 26th. However, this peak was met with strong resistance, leading to a sharp decline over the following three days. FET dropped by 27% from June 27th to 29th. It ultimately closed the week with an 8.56% loss. Despite a rebound effort, FET remains below the 20-day SMA. While this indicates bearishness, FET's MACD line remains above the signal line, suggesting potential upside.
Fetch.ai (FET) a initialement connu une dynamique haussière, augmentant de 26 % du 23 au 26 juin. Cependant, ce pic s’est heurté à une forte résistance, entraînant une forte baisse au cours des trois jours suivants. Le FET a chuté de 27 % du 27 au 29 juin. Il a finalement clôturé la semaine sur une perte de 8,56%. Malgré un effort de rebond, le FET reste en dessous de la SMA de 20 jours. Bien que cela indique une tendance baissière, la ligne MACD du FET reste au-dessus de la ligne de signal, suggérant un potentiel de hausse.


 Cryptopolitan_News
 Thecoinrepublic.com
 DogeHome
 Optimisus
 U_Today
 Optimisus
 DogeHome
 Optimisus
 Cryptopolitan_News


