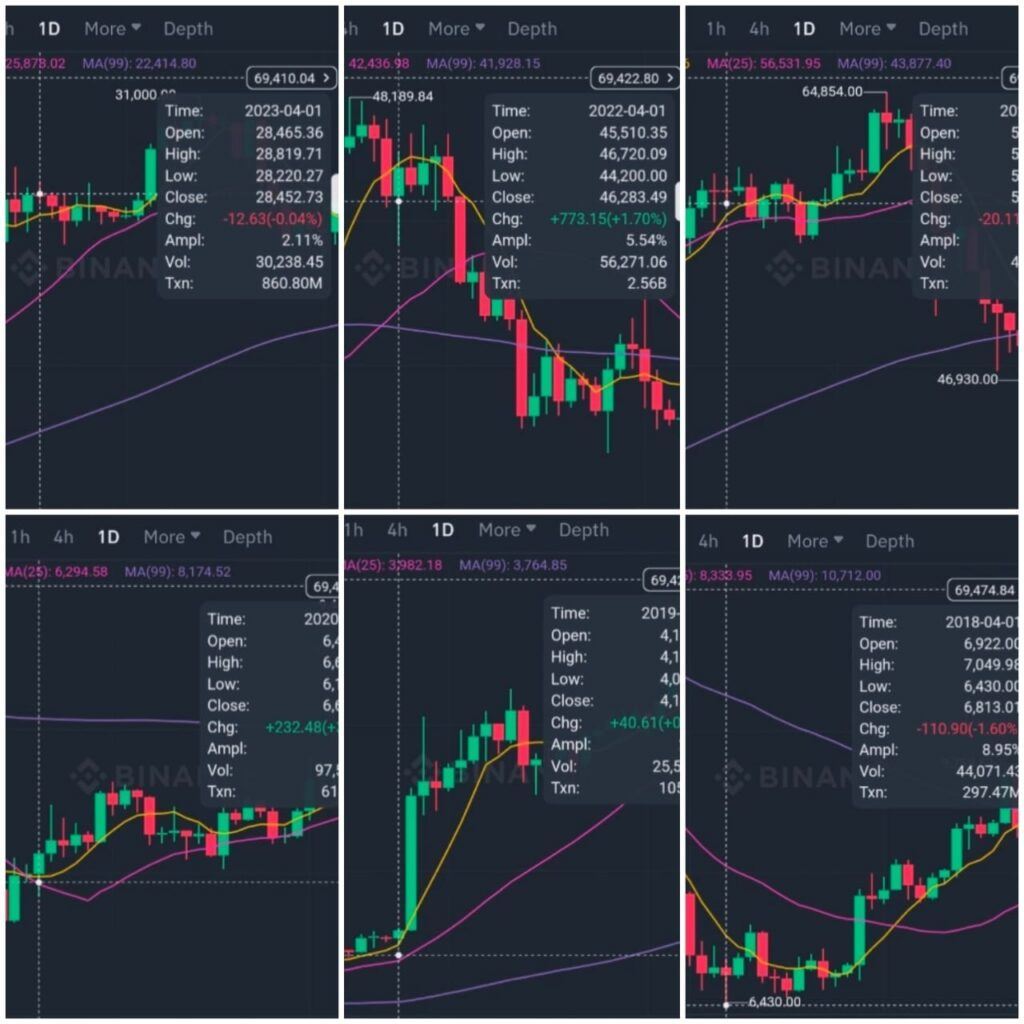
In the last six years, the cryptocurrency market has depicted varying behaviours on the first day of April. In Bitcoin and Ethereum cases, both showcased a mix of red and green performances. By observing this crypto historical data, an investor can assume the overall market’s movements and potential trends on that particular day. When it comes to
過去 6 年間、仮想通貨市場では 4 月 1 日にさまざまな動きが見られました。ビットコインとイーサリアムのケースでは、どちらも赤と緑の組み合わせのパフォーマンスを示しました。この暗号通貨の履歴データを観察することで、投資家はその日の市場全体の動きと潜在的な傾向を推測することができます。となると、
Bitcoin, which is the leading cryptocurrency, it can be seen that April 1st has been a busy day in terms of the candle’s action.
主要な暗号通貨であるビットコインにとって、4月1日はローソク足の動きから見て忙しい日だったことがわかります。
Ethereum’s April 1st Performance Mirrors Bitcoin’s Mixed Pattern
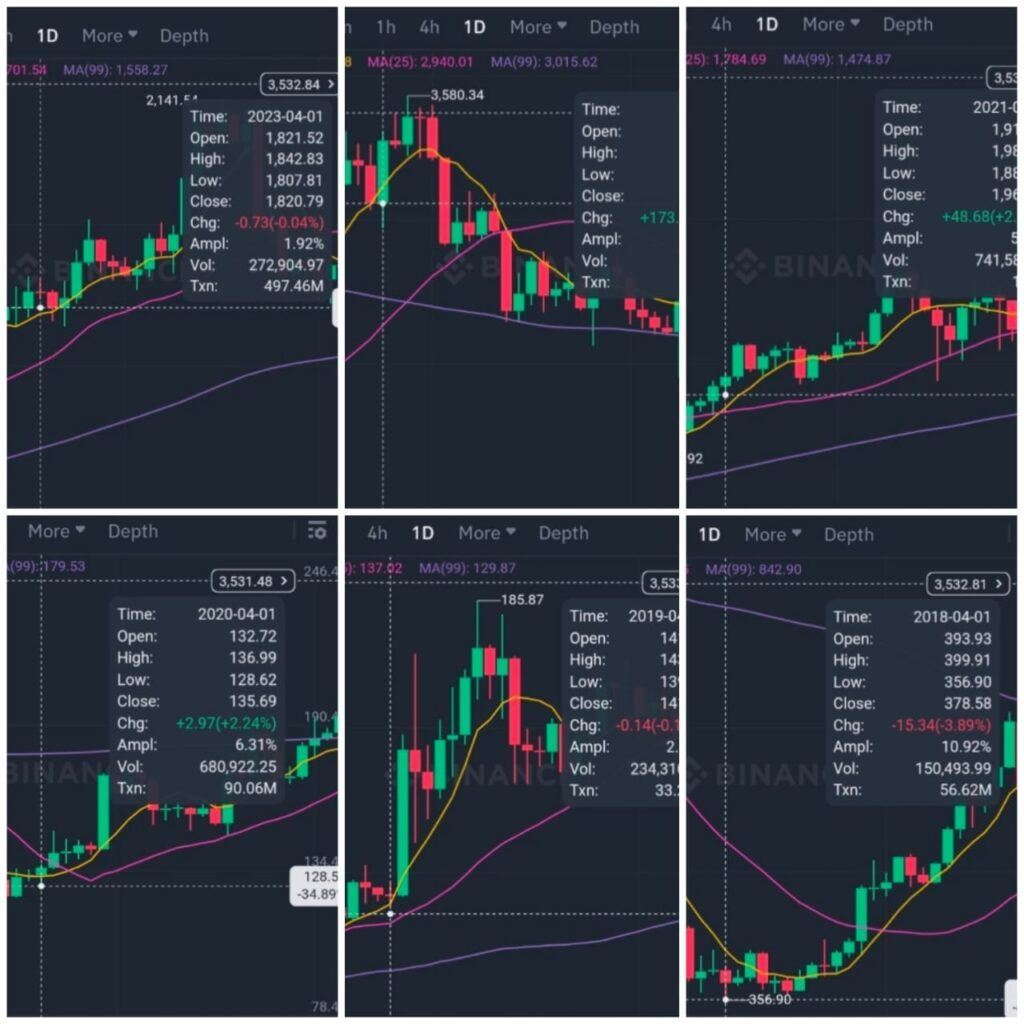
In 2018, the candle turned red, meaning that the price dropped slightly. In 2019, on the other hand, a green one appeared, meaning that the price went off a few margins. This pattern continued in 2020, and the candle was green. However, the color shifted in 2021, which saw a red candle form due to a slight decline. Finally, in 2022, the candle was red, followed by a streak of green ones in 2023.
イーサリアムの 4 月 1 日のパフォーマンスはビットコインの混合パターンを反映しています 2018 年、ローソク足が赤に変わり、価格がわずかに下落したことを意味します。一方、2019年には緑色のものが現れ、価格が数マージンを超えたことを意味します。このパターンは2020年も続き、ろうそくの色は緑色でした。しかし、2021 年には色が変わり、わずかな下落により赤いローソクが形成されました。最後に、2022 年にろうそくの色は赤になり、2023 年には緑のろうそくが続きました。
The candles of the second-largest cryptocurrency, Ethereum, also have a pattern of 3 red and 3 green. While the candles indicate fluctuations in prices for April 1st, they have been fairly short for both cryptocurrencies, which means that the prices shifted slightly. Since the total cryptocurrency market cap is estimated to be at $2.7 trillion, the dominance of 51.37% for Bitcoin equates it to $1.36 trillion of the market. All of the 1-day candles were ‘doji’ coins meaning that there was not much volatility in the past of 1st of April.
2番目に大きい仮想通貨であるイーサリアムのローソク足にも、赤が3つ、緑が3つというパターンがあります。ローソク足は 4 月 1 日の価格変動を示していますが、両方の暗号通貨でかなり短いため、価格がわずかに変化したことを意味します。仮想通貨の時価総額は 2 兆 7,000 億ドルと推定されているため、ビットコインの 51.37% の支配力は市場の 1 兆 3,600 億ドルに相当します。 1 日のローソク足はすべて「童子」コインで、過去 4 月 1 日には大きな変動がなかったことを意味します。
Bitcoin and Ethereum’s Combined Dominance at 66.15% of Crypto Market Cap
Most importantly, Bitcoin is the largest cryptocurrency in the market, and its actions play a big role in shaping the whole market. It is $426 billion in Ethereum’s hands, and this is a vast amount of the industry’s movements. Therefore, the two assets form 66.15% of the entire crypto market cap. The whole performance on April 1 target date would be crucial for setting the general market mood. Nevertheless, one must be careful and evaluate several other issues.
ビットコインとイーサリアムを合わせた仮想通貨時価総額の66.15%を占める最も重要なことは、ビットコインが市場最大の仮想通貨であり、その行動が市場全体の形成に大きな役割を果たしているということです。イーサリアムの手元には4,260億ドルがあり、これは業界の動きの膨大な額です。したがって、この 2 つの資産は暗号通貨時価総額全体の 66.15% を占めます。 4月1日の目標日における全体のパフォーマンスは、市場全体のムードを決める上で極めて重要となるだろう。それにもかかわらず、他のいくつかの問題については注意し、評価する必要があります。
As historical data has always been a mixture of red and green, several factors seem to impact the price of cryptocurrencies. Cryptocurrencies are undoubtedly volatile by design and are largely influenced by technology, regulations, and popular trends. However, the prices can differ based on macroeconomic and investor sentiments, both logically and emotionally.
過去のデータは常に赤と緑が混在しているため、いくつかの要因が暗号通貨の価格に影響を与えているようです。仮想通貨は間違いなくその設計上不安定であり、テクノロジー、規制、一般的なトレンドに大きく影響されます。ただし、価格はマクロ経済や投資家の論理的および感情的な感情に基づいて異なる場合があります。
Consequently, the way prices of cryptocurrencies have acted in previous Aprils will predict their future behavior. Until the cryptocurrency market stabilizes, and the price truly shows a more data-based pattern. Moreover, investors will need to change their strategies depending on the current situation.
したがって、過去の 4 月に仮想通貨の価格がどのように推移したかによって、将来の仮想通貨の動向が予測されることになります。仮想通貨市場が安定し、価格がよりデータに基づいたパターンを真に示すようになるまで。さらに、投資家は現在の状況に応じて戦略を変更する必要があります。


 Cryptopolitan_News
 TheNewsCrypto
 ItsBitcoinWorld
 Crypto Front News
 DogeHome
 Crypto Daily™
 Crypto News Land
 TheNewsCrypto
 CFN
CFN


