Bulls still have a firm grip on the markets, as shown by the current market cap, which is 5.9% above the previous 24-hour cap. The global market cap stood at an impressive $2.32T as of press time.
現在の時価総額が前回の24時間上限を5.9%上回っていることからもわかるように、強気派は依然として市場をしっかりと掌握している。本稿執筆時点で世界の時価総額はなんと2.32兆ドルに達しています。
Bitcoin Price Review
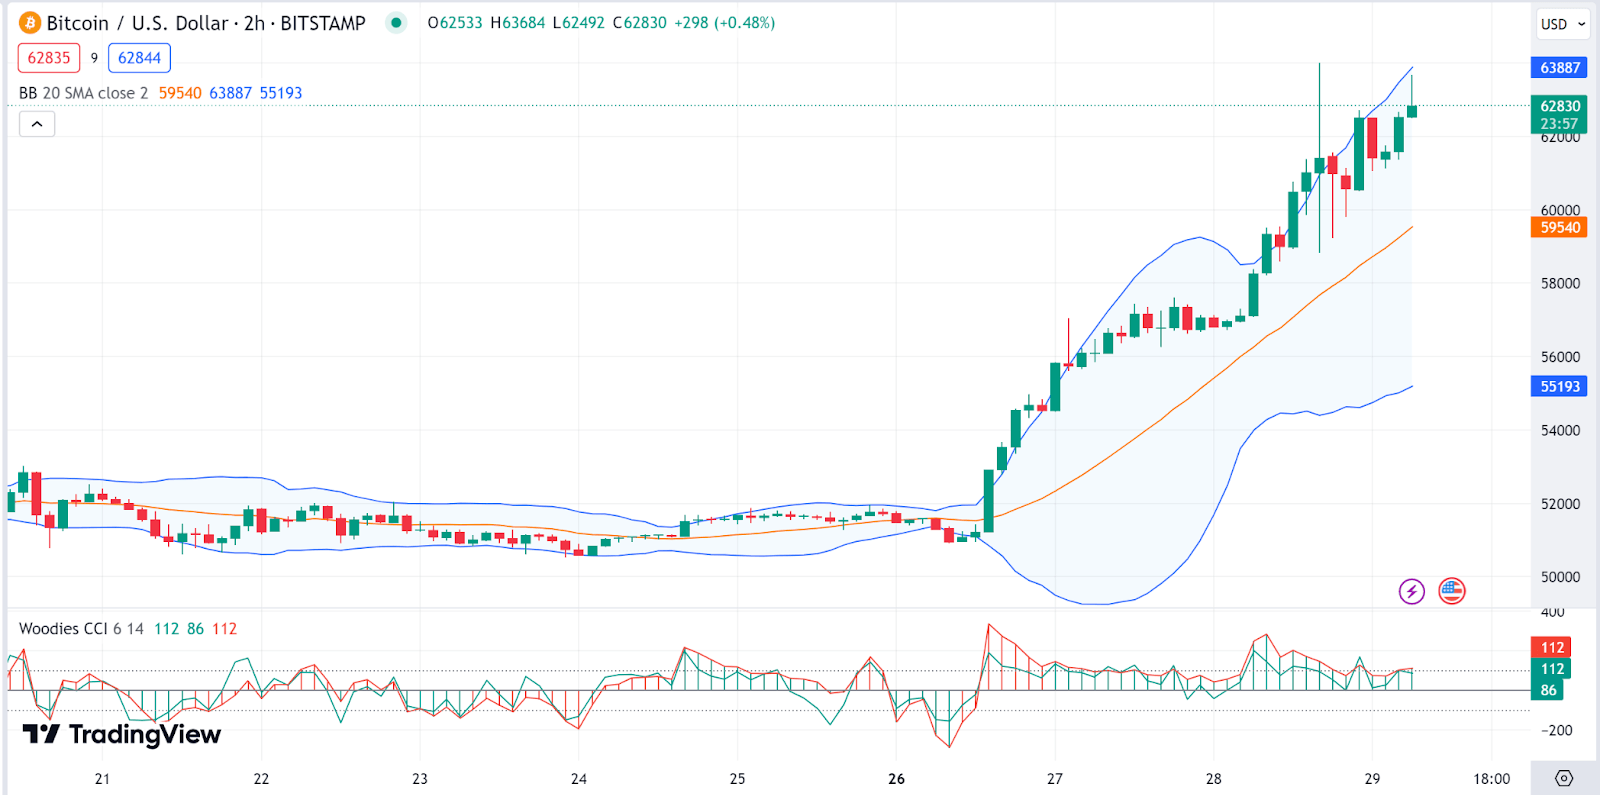
The Bitcoin (BTC) chart shows a strong uptrend indicated by consistently higher highs and higher lows. The Bollinger Bands are widening, suggesting increasing volatility as the Bitcoin price moves upwards.
ビットコイン価格のレビュービットコイン (BTC) チャートは、一貫して高値と安値の上昇によって示される強力な上昇傾向を示しています。ボリンジャーバンドは拡大しており、ビットコイン価格が上昇するにつれてボラティリティが高まっていることを示唆しています。
The Bitcoin price is currently trading near the upper Bollinger Band, which could indicate that Bitcoin is potentially overbought in the short term. The moving average (orange line) is trending upwards, and the Bitcoin price is above it, confirming the bullish trend. The Woodies CCI fluctuates around the zero line, showing some indecision in the short term, but remains in generally bullish territory. The Bitcoin price stood at $62.9K as of press time, representing a 7.2% pump in the last 24 hours.
ビットコイン価格は現在ボリンジャーバンドの上部付近で取引されており、これはビットコインが短期的に買われ過ぎている可能性があることを示している可能性があります。移動平均線 (オレンジ色の線) は上昇傾向にあり、ビットコイン価格はそれを上回っており、強気傾向が確認されています。ウッディーズ CCI はゼロライン付近で変動し、短期的には若干の優柔不断さを示していますが、概して強気の領域に留まっています。本稿執筆時点でビットコイン価格は629万ドルで、過去24時間で7.2%上昇したことになる。
 BTC 2-hour chart | Source: TradingView
BTC 2時間足チャート |出典: TradingView
Ethereum Price Review
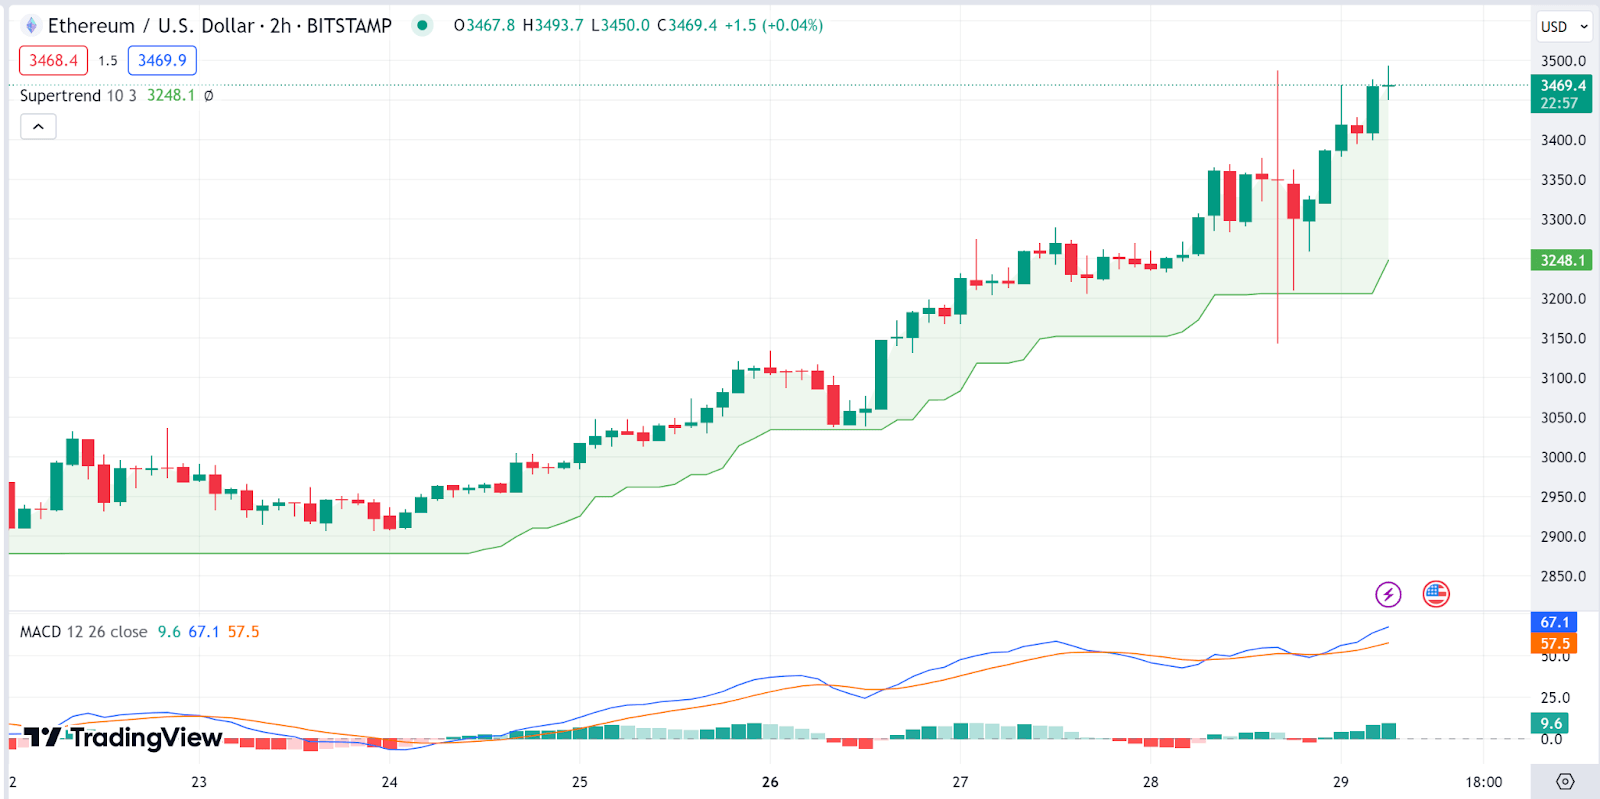
Ethereum chart also shows an uptrend, with the Ethereum price trading above the green Supertrend line, indicating a bullish phase. The Moving Average Convergence Divergence (MACD) is above the signal line and positive, which is a bullish signal.
イーサリアム価格レビューイーサリアムのチャートも上昇傾向を示しており、イーサリアム価格は緑色のスーパートレンドラインを上回って推移しており、強気の局面を示しています。移動平均収束ダイバージェンス (MACD) はシグナルラインを上回っており、プラスであり、強気のシグナルです。
The MACD histogram is also positive, indicating strong momentum on the Ethereum price trajectory. The Ethereum price stood at $3460 as of press time, representing a 4.3% pump in the last 24 hours.
MACD ヒストグラムもプラスであり、イーサリアム価格の軌道に強い勢いがあることを示しています。イーサリアムの価格は記事執筆時点で3460ドルで、過去24時間で4.3%上昇したことを意味する。
 ETH 2-hour chart | Source: TradingView
ETH 2時間足チャート |出典: TradingView
Bonk Price Review
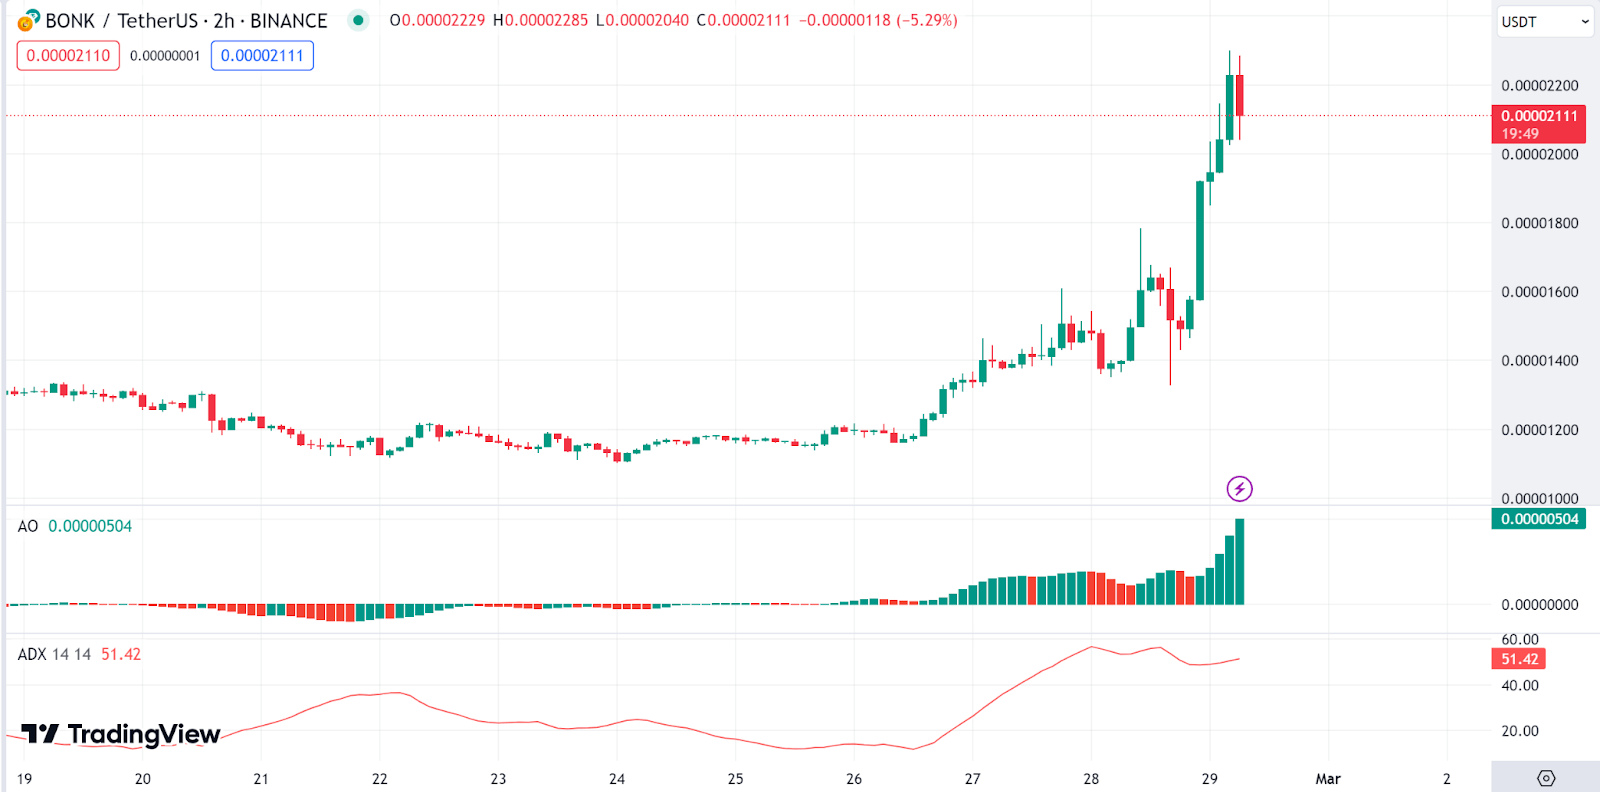
Bonk (BONK) is today’s top gainer as meme coins take center stage. BONK has experienced a sharp price increase, as the long green candles indicate. The Awesome Oscillator (AO) shows a strong bullish momentum as the green bars increase in height.
Bonk 価格レビューBonk (BONK) は、ミームコインが注目を集める中、今日のトップの値上がり者です。緑の長いローソク足が示すように、BONK は急激な価格上昇を経験しました。オーサム オシレーター (AO) は、緑色のバーの高さが増加するにつれて、強い強気の勢いを示します。
The Average Directional Index (ADX) is above 25, suggesting a solid trend. However, the ADX line is flat, which may indicate the trend strength is not increasing. The Bonk price stood at $0.00002161 as of press time, representing a 53.7% pump in the last 24 hours.
平均方向性指数 (ADX) は 25 を超えており、堅調な傾向を示しています。ただし、ADX ラインは横ばいであり、これはトレンドの強さが増加していないことを示している可能性があります。ボンク価格は記事執筆時点で 0.00002161 ドルで、過去 24 時間で 53.7% 上昇しました。
 BONK 2-hour chart | Source: TradingView
BONK 2時間足チャート |出典: TradingView
Dogecoin Price Review
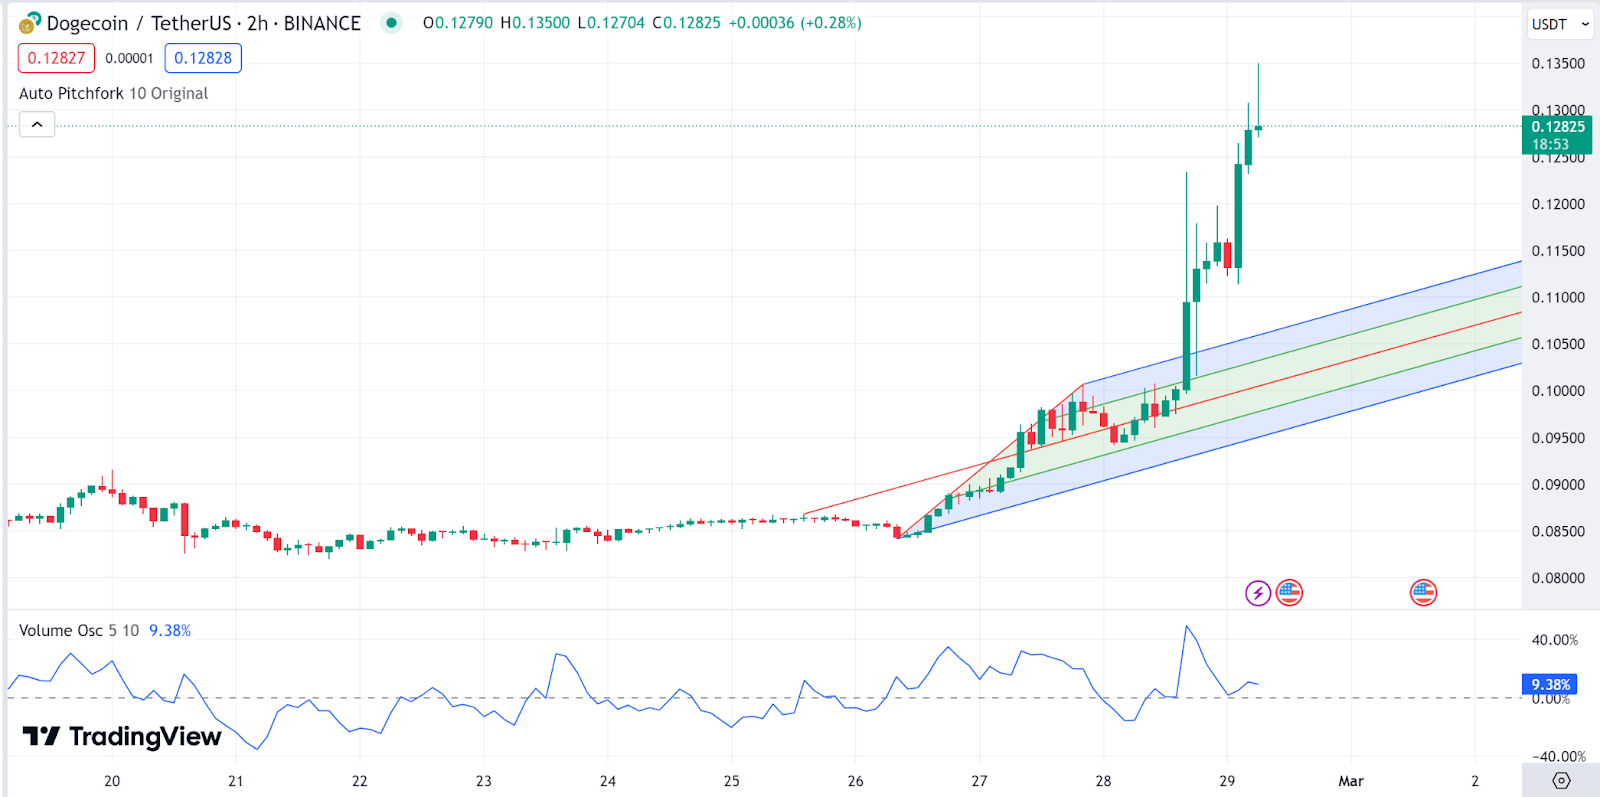
Dogecoin is the second top gainer today as seen from our analysis. The chart shows a strong bullish trend, with Dogecoin price consistently making higher highs. The Auto Pitchfork tool shows the Dogecoin price trading in the upper half of the pitchfork, indicating strong buying pressure.
Dogecoin 価格レビューDogecoin は、分析からわかるように、今日 2 番目に上昇した銘柄です。チャートは強い強気傾向を示しており、ドージコインの価格は一貫して高値を更新しています。 Auto Pitchfork ツールは、ドージコインの価格がピッチフォークの上半分で取引されていることを示しており、強い購入圧力を示しています。
The Volume Oscillator is positive, suggesting that volume is increasing on up days, which supports the bullish Dogecoin price action. The Dogecoin price stood at $0.1265 as of press time, representing a 26.2% pump in the last 24 hours.
出来高オシレーターはプラスであり、上昇日には出来高が増加していることを示唆しており、これがドージコインの強気の価格行動を裏付けています。記事執筆時点でドージコインの価格は0.1265ドルで、過去24時間で26.2%の上昇を示している。
 DOGE 2-hour chart | Source: TradingView
DOGE 2時間足チャート |出典: TradingView
Shiba Inu Price Review
Shiba Inu is the third and our last top gainer today. SHIB is showing a parabolic rise with the price moving sharply away from the moving averages. The Alligator indicator is in a bullish formation, with the green, red, and blue lines (jaw, teeth, and lips) nicely fanned out and the Shiba Inu price above all three.
柴犬の価格レビュー今日、柴犬は 3 番目で最後のトップゲインです。 SHIBは放物線状の上昇を示しており、価格は移動平均線から大きく離れています。アリゲーターインジケーターは強気のフォーメーションを形成しており、緑、赤、青の線 (顎、歯、唇) がきれいに扇状に広がっており、柴犬の価格が 3 つすべての上にあります。
The MACD is far above the signal line and the histogram bars are growing, indicating strong bullish momentum. The Shiba Inu price stood at $0.00001363 as of press time, representing a 25.67% pump in the last 24 hours.
MACD はシグナルラインをはるかに上回っており、ヒストグラムのバーは増加しており、強い強気の勢いを示しています。この記事の執筆時点で、柴犬の価格は 0.00001363 ドルで、過去 24 時間で 25.67% 上昇しました。
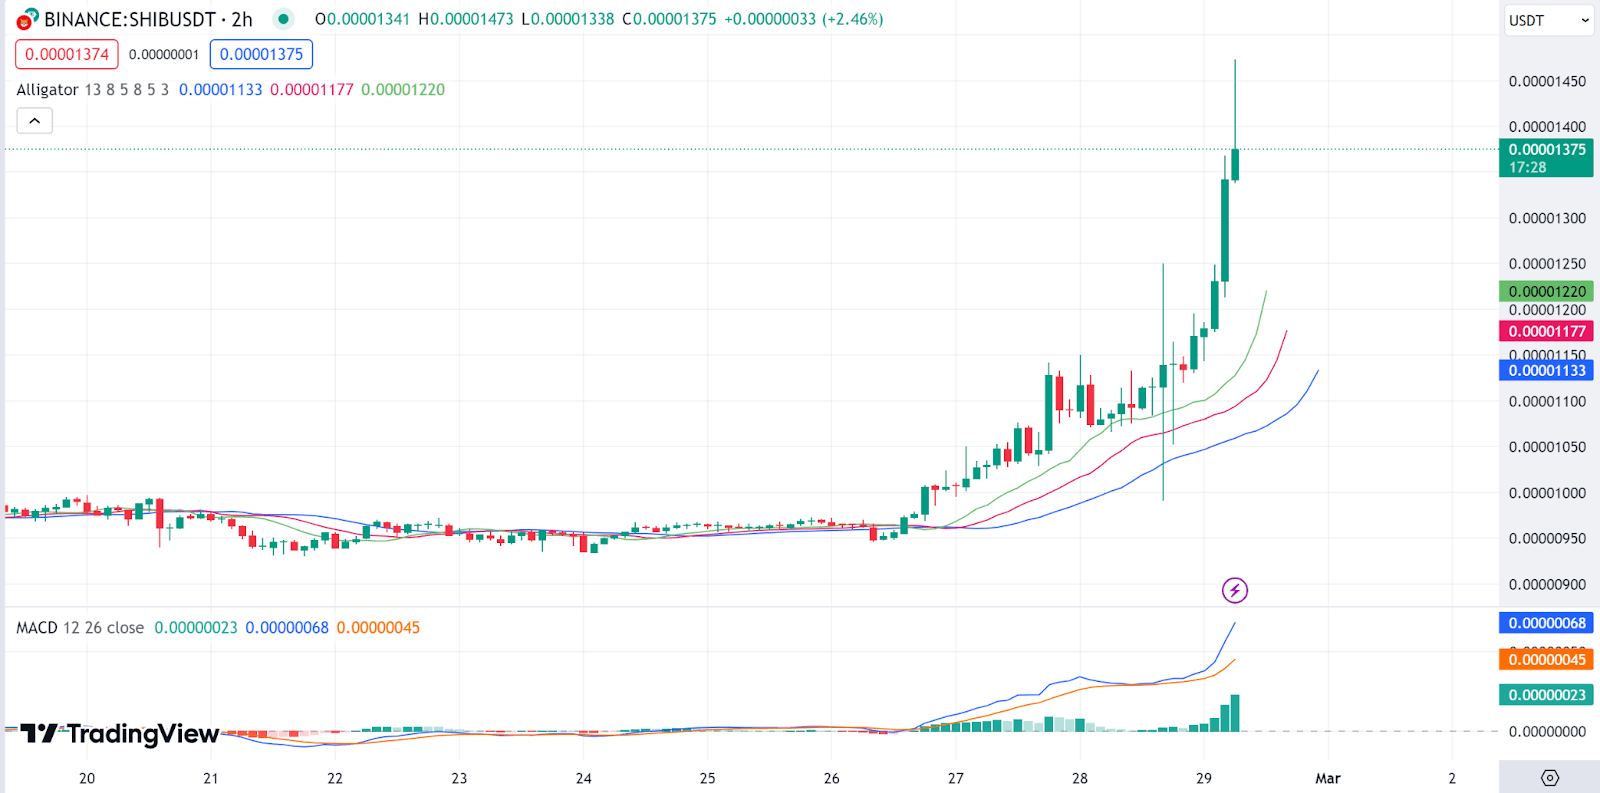 SHIB 2-hour chart | Source: TradingView
SHIB2時間足チャート |出典: TradingView


 Crypto Daily™
 ETHNews
 Coin Edition
 DogeHome
 Crypto Daily™
 BlockchainReporter
 Crypto Daily™
 Crypto Daily™
 crypto.news


