2023 年 10 月 15 日 06:35 // 価格
Coin Idol
著者コインアイドル

Cryptocurrency price Analysis brought by Coinidol.com. Dogecoin (DOGE) price is falling below the moving average lines.
Coinidol.com が提供する暗号通貨の価格分析。ドージコイン(DOGE)の価格は移動平均線を下回っています。
Dogecoin price long term forecast: bearish
ドージコイン価格の長期予測:弱気
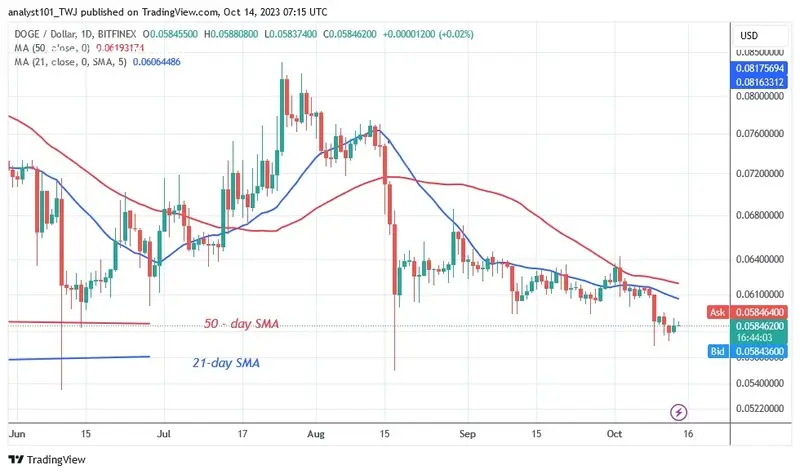
The cryptocurrency asset lost value last week as the bears broke the price range of $0.060 to $0.064. The moving average lines have slowed down the upward movement, which extended to the $0.056 support. At the time of writing, Dogecoin is worth $0.058. The price has not changed above the current support. The price has been circling above the $0.056 support since October 9. The altcoin will continue to fall if the current support level is lost until it reaches the $0.055 support. DOGE will see an uptrend if the price rises above the moving average line and the barrier at $0.064.
先週、弱気派が0.060ドルから0.064ドルの価格帯を突破したため、暗号通貨資産の価値は下落した。移動平均線は上向きの動きを鈍化させており、その動きは0.056ドルのサポートまで広がっている。執筆時点では、ドージコインの価値は0.058ドルです。価格は現在のサポートを超えて変更されていません。 10月9日以来、価格は0.056ドルのサポートを上回って推移している。現在のサポートレベルが失われると、アルトコインは0.055ドルのサポートに達するまで下落し続けるだろう。 DOGEは、価格が移動平均線と0.064ドルの障壁を上回った場合、上昇トレンドと見なされます。
Dogecoin indicator display
ドージコインインジケーター表示
The price bars for the cryptocurrency are below the moving average lines, leading to a decline below $0.060. The altcoin tends to fall as long as the price bars are below the moving average lines. The scenario is the opposite when the price bars are above the moving average lines.
仮想通貨の価格バーは移動平均線を下回っており、0.060ドルを下回る下落につながっています。アルトコインは、価格バーが移動平均線を下回っている限り、下落する傾向があります。価格バーが移動平均線の上にある場合、シナリオは逆になります。

Technical indicators
テクニカル指標
Key resistance levels – $0.12 and $0.14
主要な抵抗レベル – 0.12 ドルと 0.14 ドル
Key support levels – $0.06 and $0.04
主要なサポート レベル – 0.06 ドルと 0.04 ドル
What is the next direction for Dogecoin?
ドージコインの次の方向性は何でしょうか?
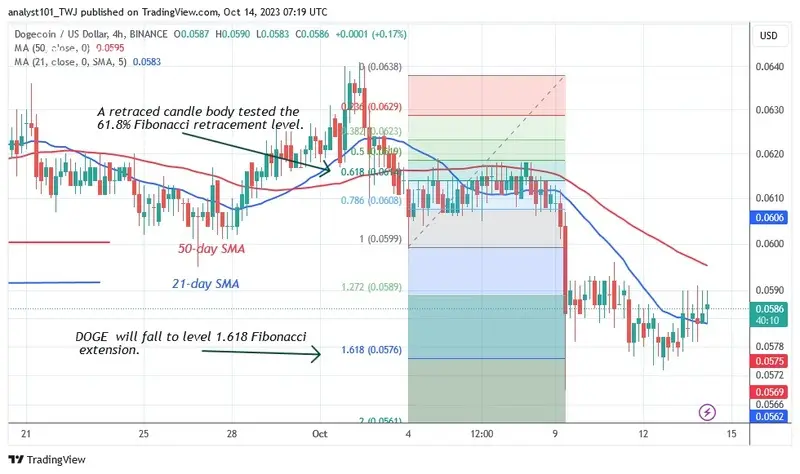
The downtrend has already reached a level above the $0.057 support. The price indicator predicts that DOGE will fall to the 1.618 level of the Fibonacci extension or the $0.057 level. In the shorter term, the price has crossed the 21-day line SMA, but resistance at $0.059 remains.
下降トレンドはすでに0.057ドルのサポートを超えるレベルに達しています。価格指標は、DOGEがフィボナッチエクステンションの1.618レベルまたは0.057ドルのレベルに下落すると予測しています。短期的には、価格は21日線SMAを超えていますが、0.059ドルの抵抗線が残っています。

Last week Coinidol.com reported that apart from the rally on October 1, there was no price change. The altcoin rose on October 1 and surpassed the moving average lines.
Coinidol.comは先週、10月1日の上昇を除けば価格に変化はなかったと報じた。アルトコインは10月1日に上昇し、移動平均線を上回った。
Disclaimer. This Analysis and forecast are the personal opinions of the author and are not a recommendation to buy or sell cryptocurrency and should not be viewed as an endorsement by CoinIdol.com. Readers should do their research before investing in funds.
免責事項。この分析と予測は著者の個人的な意見であり、暗号通貨の売買を推奨するものではなく、CoinIdol.com による支持とみなされるべきではありません。読者はファンドに投資する前にリサーチを行う必要があります。
Source: https://thebittimes.com/dogecoin-circles-above-0-057-low-and-resumes-its-ascent-tbt66420.html
出典: https://thebittimes.com/dogecoin-circles-above-0-057-low-and-resumes-its-ascent-tbt66420.html


 Crypto Daily™
 Crypto Daily™
 DogeHome
 TheCoinrise Media
 Thecoinrepublic.com
 TheCoinrise Media
 TheCoinrise Media
 Cryptopolitan_News


