Dogecoin Price Roller Coaster, Oversold Indicator Emerges
ドージコイン価格のジェットコースター、売られ過ぎ指標が出現
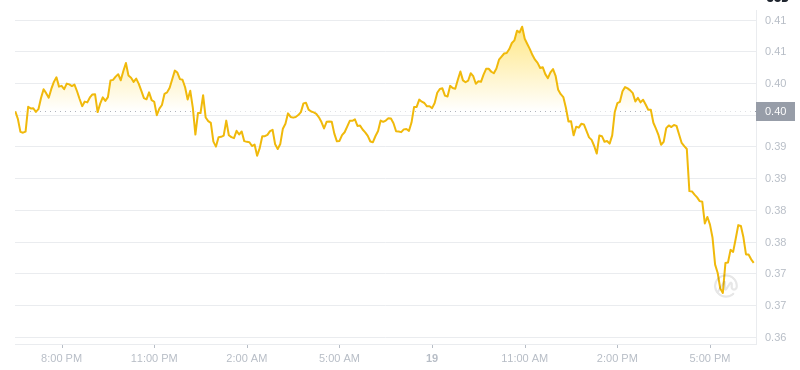
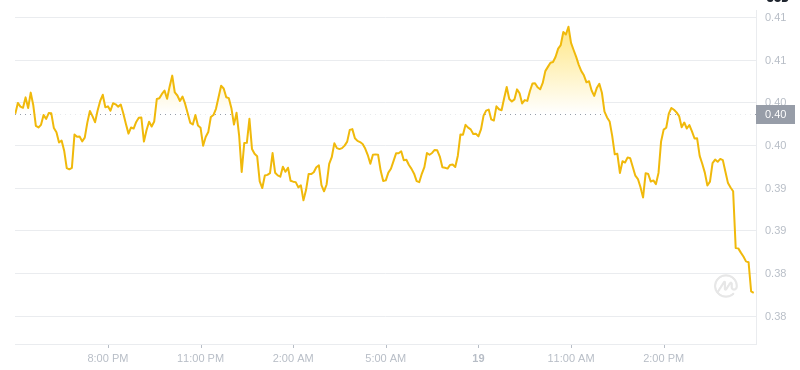
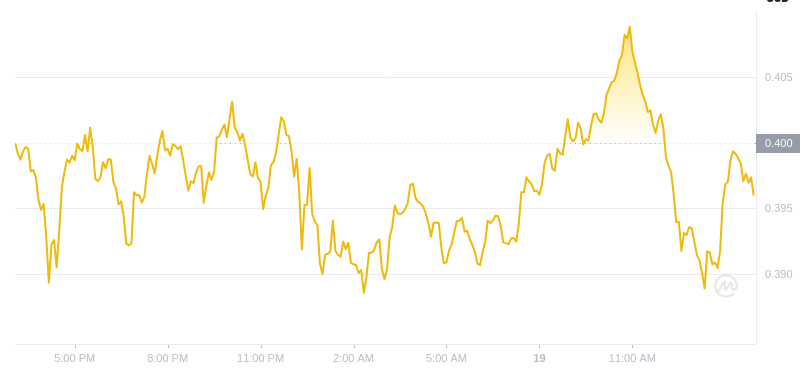
The price of Dogecoin (DOGE) has experienced significant volatility over the past 24 hours, declining by over 11%. This price movement resulted in liquidations worth over $35.1 million.
ドージコイン (DOGE) の価格は過去 24 時間で大幅な変動を経験し、11% 以上下落しました。この価格変動により、3,510 万ドル以上相当の清算が発生しました。
Despite the recent losses, one technical indicator suggests that Dogecoin may be undervalued. The Bollinger Bands, developed by John Bollinger, indicate when an asset is overbought or oversold.
最近の損失にもかかわらず、あるテクニカル指標はドージコインが過小評価されている可能性を示唆しています。ジョン・ボリンジャーによって開発されたボリンジャーバンドは、資産が買われすぎまたは売られすぎていることを示します。
The Bollinger Bands consist of a 20-day moving average with upper and lower deviation bands. When the price moves outside of these bands, it can signal an imbalance in supply and demand.
ボリンジャー バンドは、上下の偏差バンドを持つ 20 日移動平均で構成されます。価格がこれらの範囲を外れると、需要と供給の不均衡を示す可能性があります。
Currently, Dogecoin's price has fallen below the lower Bollinger Band on all time frames, including the daily chart. This indicates that the asset is oversold and historically suggests a potential for a correction.
現在、ドージコインの価格は日足チャートを含むすべての時間枠でボリンジャーバンドの下限を下回っています。これは、資産が売られすぎていることを示しており、歴史的には調整の可能性を示唆しています。
However, it is important to note that technical indicators alone cannot predict future price movements with certainty. The timing of a potential reversal remains uncertain.
ただし、テクニカル指標だけでは将来の値動きを確実に予測することはできないことに注意することが重要です。潜在的な反転のタイミングは依然として不透明だ。


 Cryptopolitan_News
 BlockchainReporter
 DogeHome
 BlockchainReporter
 DogeHome
 Captain Altcoin
 Crypto Intelligence
 DogeHome
 Crypto Intelligence


