You can also read this news on COINTURK NEWS: Dogecoin Price Analysis Amid Market Fluctuations
このニュースは COINTURK NEWS でもお読みいただけます: 市場変動の中でのドージコイン価格分析
Dogecoin (DOGE) price was affected by the recent drop in Bitcoin, resulting in a sharp decline that continued the downward trend since December 2023. Despite the drop, Dogecoin’s price is still moving within the boundaries of a short-term formation. The question is whether it can bounce back from its current position or if a potential break could deepen the decline.
ドージコイン(DOGE)の価格は、最近のビットコインの下落の影響を受け、急激な下落となり、2023年12月以来下落傾向が続いています。下落にもかかわらず、ドージコインの価格は依然として短期形成の範囲内で推移しています。問題は、現在の位置から回復できるかどうか、それとも潜在的なブレイクにより下落がさらに深まる可能性があるかどうかだ。
Current State of Dogecoin
ドージコインの現状
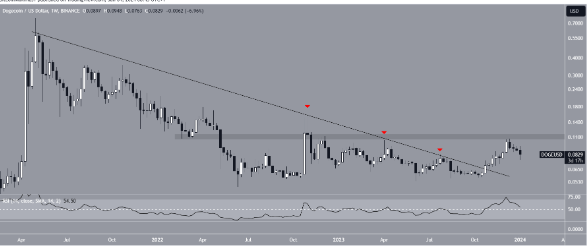
Since April 2021, DOGE’s price has been following a decreasing resistance trend line. In June 2022, the price reached a disappointing low of $0.049. Despite several unsuccessful attempts to break through the decreasing resistance line (indicated by red symbols), the price eventually broke above the trend line in November 2023.
2021年4月以来、DOGEの価格は減少する抵抗トレンドラインをたどっています。 2022年6月、価格は0.049ドルという残念な安値に達しました。減少するレジスタンスライン(赤色の記号で示される)を突破する試みは何度か失敗しましたが、価格は最終的に2023年11月にトレンドラインを上抜けました。
This breakout led to a rise until December, stopping just below a significant horizontal resistance area. The price climbed to the highest level of 2023 at $0.108. Since then, Dogecoin has been experiencing a downward price movement.
このブレイクアウトは12月まで上昇につながり、重要な水平抵抗領域のすぐ下で止まりました。価格は2023年の高値となる0.108ドルまで上昇した。それ以来、ドージコインの価格は下落しています。

A weekly RSI analysis shows the value is still above 50, but it reached this point by decreasing, not increasing. The drop over the last two weeks from the 70 level indicates a weakening in price.
毎週の RSI 分析では、この値は依然として 50 を超えていますが、増加ではなく減少によってこの点に達しました。過去 2 週間の 70 レベルからの下落は、価格の弱体化を示しています。
The situation suggests that there has been a change in momentum following the recent highest level, which requires traders to be more cautious about their investments.
この状況は、最近の最高値の後に勢いに変化があったことを示唆しており、トレーダーは投資についてより慎重になる必要がある。
DOGE Price Prediction
DOGE価格予測
It is difficult to determine a clear direction in the weekly timeframe, similar to the daily trend, due to daily price movements and RSI.
日足のトレンドと同様に、週足の時間足でも、日々の値動きやRSIの影響で明確な方向性を判断するのは困難です。
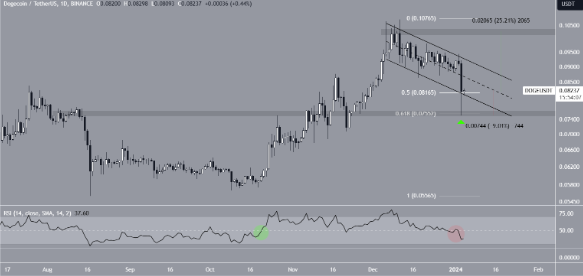
Looking at the price movement, DOGE has been moving within a decreasing parallel channel since December 11. Such movements generally bring corrections.
価格の動きを見ると、DOGE は 12 月 11 日以降、減少する平行チャネル内で推移しています。このような動きは一般に調整をもたらします。
Yesterday’s sudden price drop caused a move below the channel’s support trend line, but DOGE showed buying pressure with a long lower wick (green symbol). The wick confirmed the horizontal support level at $0.075. Following this price action, DOGE returned to the boundaries of the past channel.
昨日の突然の価格下落により、チャネルのサポートトレンドラインを下回る動きを引き起こしましたが、DOGEは長い下芯(緑色のシンボル)で買い圧力を示しました。芯は0.075ドルの水平サポートレベルを確認した。この価格変動を受けて、DOGE は過去のチャネルの境界に戻りました。

Despite the strong price stance, a downward trend is observed in the daily RSI. For the first time since October, the RSI has fallen below 50 (red circle). Therefore, it is uncertain what kind of price movement DOGE may experience.
強気の価格スタンスにもかかわらず、日次RSIでは下降傾向が見られます。 RSIは10月以来初めて50を下回りました(赤丸)。したがって、DOGE がどのような値動きを経験するかは不確実です。
A new breakout in the channel could lead to a further decline and trigger a 9% drop to revisit the $0.075 support level. On the other hand, an upward breakout in the channel could bring a 25% rise to the next resistance level of $0.100.
チャネルの新たなブレイクアウトはさらなる下落につながり、0.075ドルのサポートレベルを再訪するために9%の下落を引き起こす可能性があります。一方、チャネルが上向きにブレイクアウトすると、次の抵抗レベルである0.100ドルまで25%上昇する可能性があります。
The post first appeared on COINTURK NEWS: Dogecoin Price Analysis Amid Market Fluctuations
この投稿は COINTURK NEWS に最初に掲載されました: 市場変動の中でのドージコイン価格分析


 DogeHome
 Optimisus
 Crypto News Land
 Optimisus
 Cryptopolitan_News
 Cryptopolitan
 crypto.ro English


