

Dogecoin (DOGE) is back on the move after a brief correction from November highs at $0.0877 to support slightly above $0.7. Unlike other cryptos, the most prominent meme coin is not trimming gains but rebounding towards the psychological resistance at $0.1.
ドージコイン(DOGE)は、11月の高値0.0877ドルから0.7ドルをわずかに上回るサポートまで一時的に調整した後、再び上昇に転じている。他の仮想通貨とは異なり、最も顕著なミームコインは利益をトリミングするのではなく、0.1ドルの心理的抵抗に向けて反発しています。
In the last seven days, DOGE price has increased by 8.5% to $0.082 not to mention the cumulative 17% gains in 30 days, CoinGecko market data shows. Over half a billion dollars in trading volume has been recorded by traders across exchanges with the market cap growing to $11.6 billion.
CoinGecko市場データによると、過去7日間でDOGE価格は8.5%上昇して0.082ドルとなり、30日間で累積17%上昇したことは言うまでもありません。各取引所のトレーダーによって5億ドルを超える取引高が記録され、時価総額は116億ドルにまで拡大しました。
Dogecoin Price Prediction: DOGE Recoils From Double-Bottom Pattern
ドージコインの価格予測:ドージはダブルボトムパターンから反動
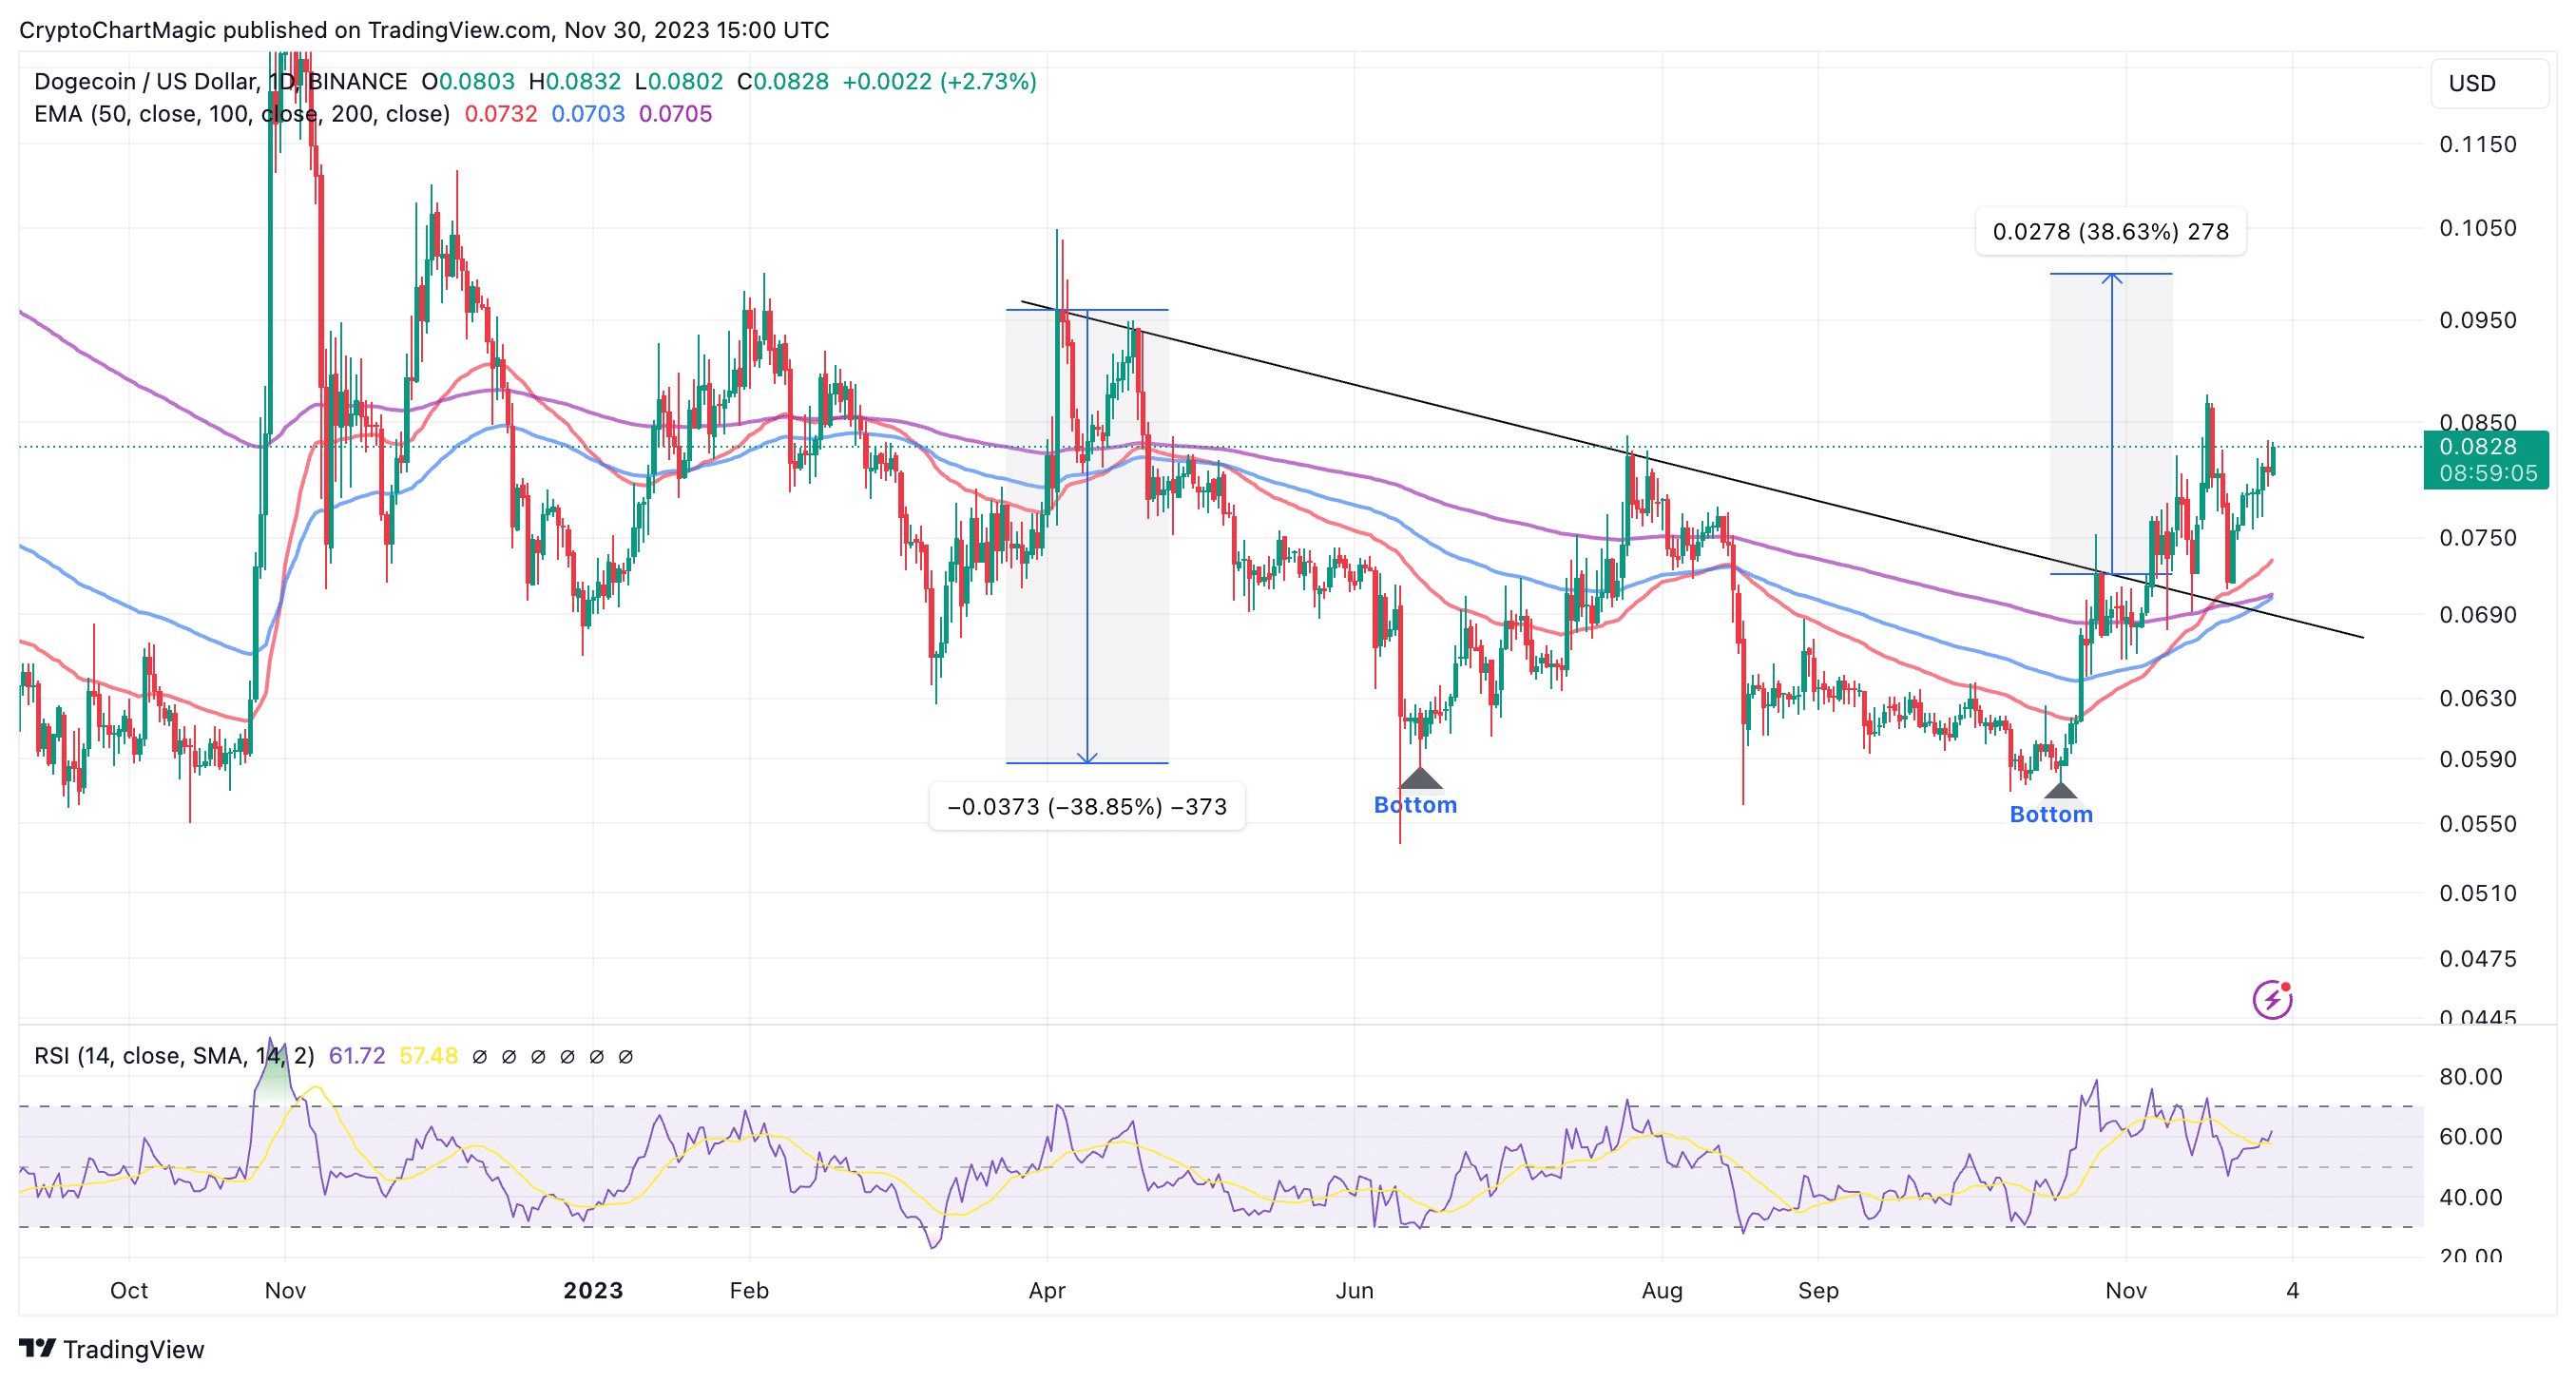
The path with the least resistance has sustained upwards since Dogecoin price hit the bottom twice at $0.058. Recovery above all three moving averages including the 50-day Exponential Moving Average (EMA) (red), the 100-day EMA (blue), and the 200-day EMA (purple) assured traders of a bullish era.
ドージコイン価格が 0.058 ドルで 2 回底を打って以来、抵抗が最も少ないパスは上昇を維持しています。 50日指数移動平均(EMA)(赤)、100日EMA(青)、200日EMA(紫)を含む3つの移動平均線すべてを上回る回復は、トレーダーに強気時代の到来を確信させた。
Further movement above the double-bottom pattern’s neckline resistance called upon more traders to launch long positions in DOGE. This contributed immensely to the tailwind, which pushed Dogecoin price to $0.0877.
ダブルボトムパターンのネックライン抵抗をさらに上回る動きにより、より多くのトレーダーがDOGEでロングポジションを開始するよう求められました。これは追い風に大きく貢献し、ドージコインの価格を0.0877ドルまで押し上げました。
With the neckline resistance successfully tested, resulting in an ongoing uptrend continuation, DOGE might close the gap to $0.1 before or during the weekend.
ネックラインの抵抗が正常にテストされ、上昇トレンドが継続する結果、DOGEは週末前または週末中にギャップを0.1ドルに縮める可能性があります。
The Relative Strength Index (RSI) at 61 reveals buyers have the upper hand. As this trend strength indicator climbs toward the overbought region above 70, the odds flip in favor of the bulls.
相対力指数(RSI)は61で、買い手が優勢であることを示しています。このトレンドの強さの指標が 70 を超える買われ過ぎの領域に向かって上昇すると、オッズは強気派に有利に反転します。
A bullish cross pattern is on the cusp of forming if the 100-day EMA moves above the 200-day EMA. This would be the third golden cross in November. The initial bullish cross came into the picture when the 50-day EMA flipped above the 100-day EMA, followed by the second one when the same 50-day EMA moved above the 200-day EMA.
100日EMAが200日EMAを上回れば、強気のクロスパターンが形成されようとしています。これは11月で3回目のゴールデンクロスとなる。最初の強気クロスは、50 日 EMA が 100 日 EMA を上回ったときに現れ、次に同じ 50 日 EMA が 200 日 EMA を上回ったときに 2 番目のクロスが現れました。
According to an anonymous analyst, seba26-77, who posts insights on Tradingview, Dogecoin price is dealing with the same resistance it was struggling to break roughly a year ago.
Tradingviewに分析情報を投稿している匿名のアナリストseba26-77氏によると、ドージコインの価格は約1年前に破るのに苦労したのと同じ抵抗に直面しているという。
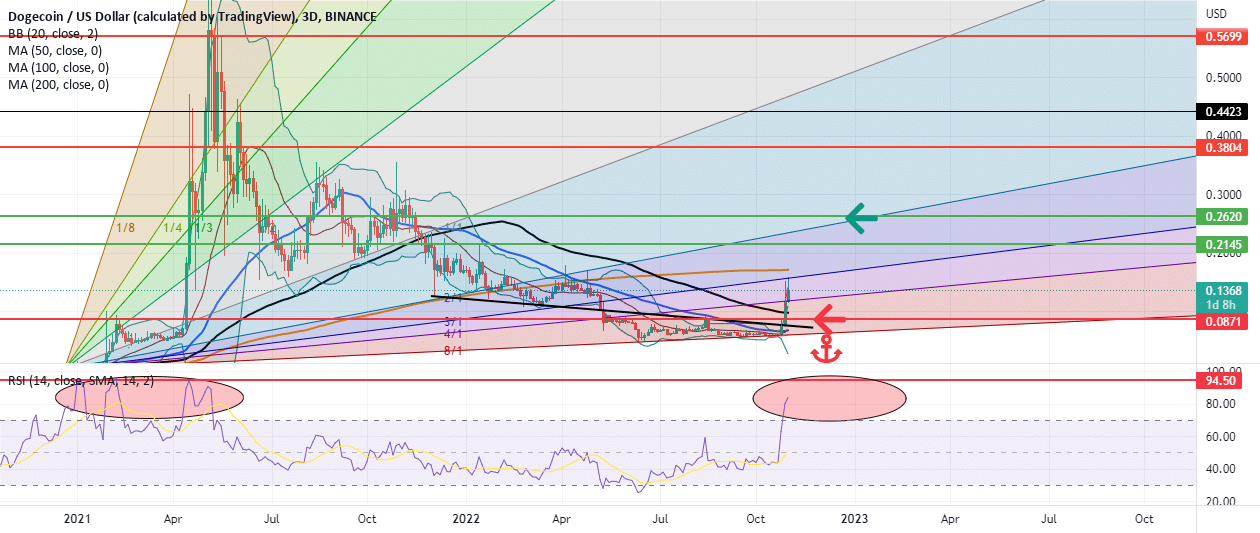
From the chart, DOGE must break the blockade at $0.086 in the coming days – a move likely to see it rise to $0.12 by the end of 2023, representing a 60% move from the current market value.
チャートから見ると、DOGEは数日以内に0.086ドルの封鎖を突破する必要があり、これにより2023年末までに0.12ドルまで上昇する可能性があり、これは現在の市場価格から60%の上昇となる。
The weekly chart reveals a breakout from a falling wedge pattern. This pattern serves as a continuation signal, allowing for consolidation due to profit-taking, ahead of another breakout.
週足チャートは、下降ウェッジパターンからのブレイクアウトを明らかにしています。このパターンは継続シグナルとして機能し、別のブレイクアウトに先立って利益確定による値固めを可能にします。
Dogecoin price is expected to keep the uptrend intact as long as the breakout is backed by increasing volume. Moreover, the 50-week EMA is in line to provide support at $0.755.
ドージコインの価格は、出来高の増加によってブレイクアウトが裏付けられている限り、上昇トレンドを維持すると予想されます。さらに、50週間EMAは0.755ドルがサポートラインとなる。
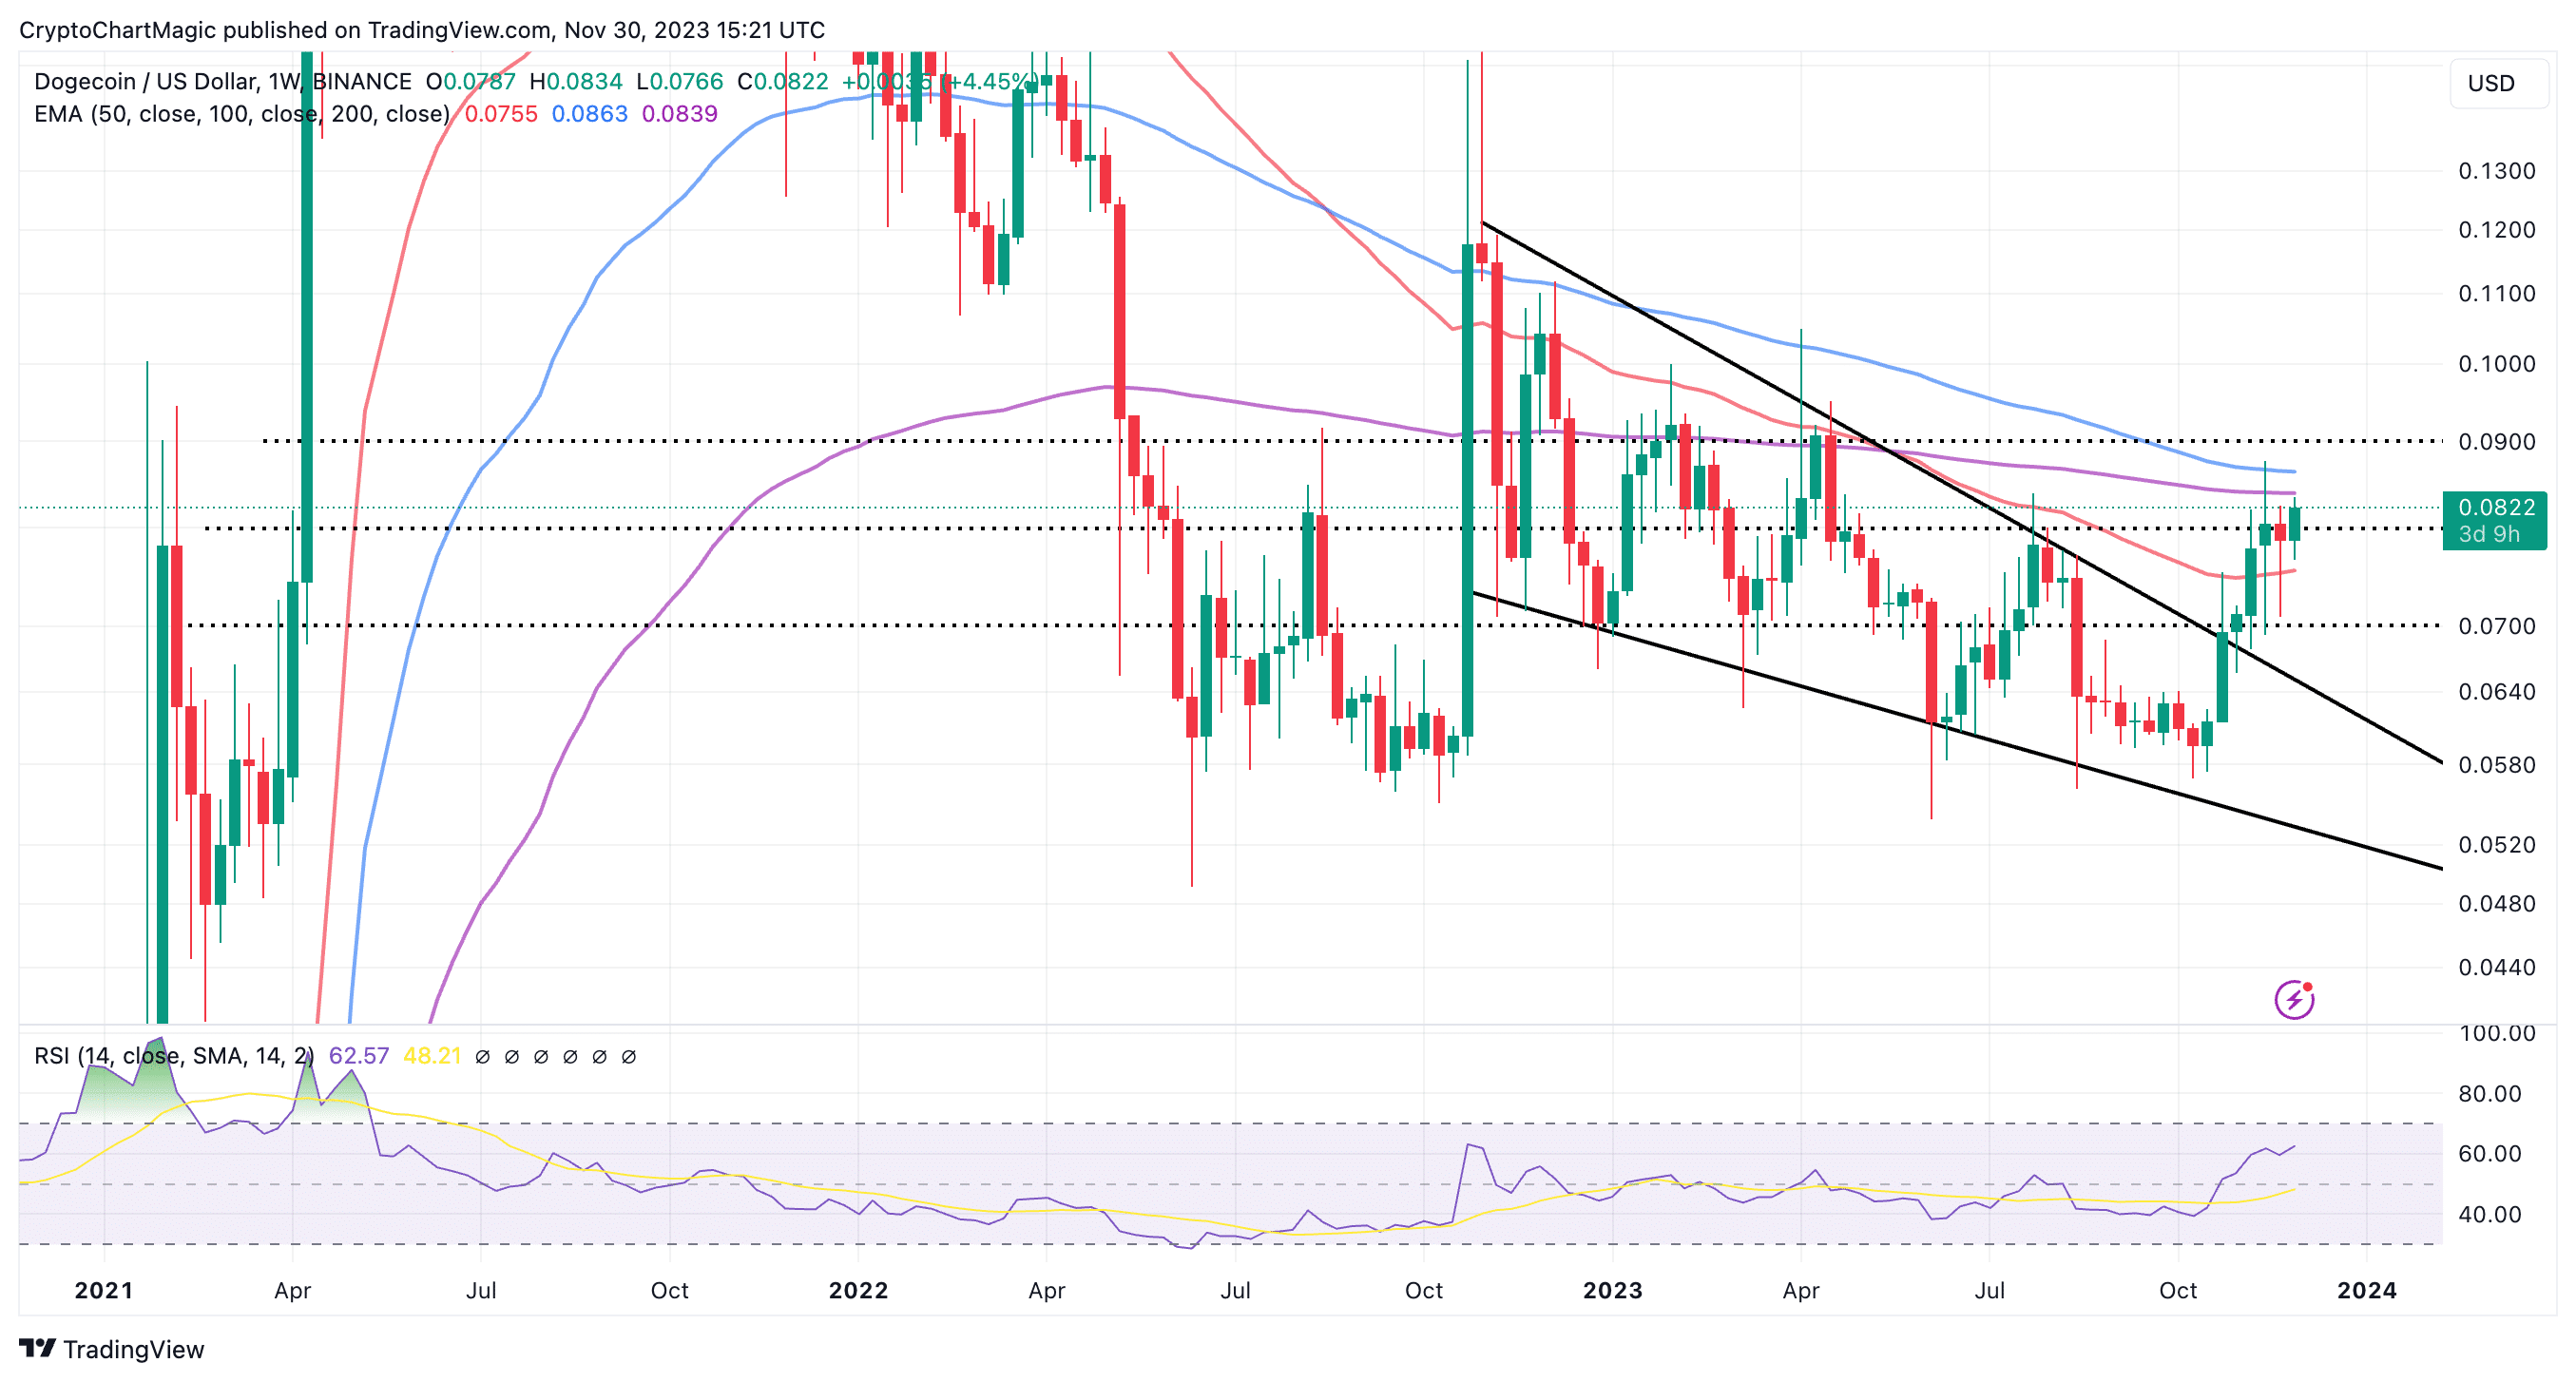
It would not be prudent to assume that Dogecoin is out of the woods, with the 200-week EMA hindering movement at $0.0839 and the 100-week EMA at $0.864. Trading above these two key zones might encourage more buyers to join the uptrend due to the possibility of DOGE price starting a new bullish phase above $0.1.
200週間EMAが0.0839ドル、100週間EMAが0.864ドルで動きを妨げているため、ドージコインが危機を脱したと考えるのは賢明ではありません。これら 2 つの主要ゾーンを超えて取引すると、DOGE 価格が 0.1 ドルを超えて新たな強気局面を開始する可能性があるため、より多くの買い手が上昇トレンドに加わる可能性があります。
Related Articles
関連記事
- LUNC Perpetual Contract Launch: Is Terra Classic (LUNC) Set For A Bullish Surge?
- Bitcoin Bull Cathie Wood’s Ark Invest Sells Coinbase (COIN), Buys Robinhood Shares
- Ethereum Price Prediction: Will $ETH Surpass $3000 in December?
LUNC 無期限契約の開始: Terra Classic (LUNC) は強気の急騰をする予定ですか?
ビットコイン雄キャシー・ウッドのアーク・インベストがコインベース(COIN)を売却し、ロビンフッド株を購入
イーサリアム価格予測:12月に$ETHは3000ドルを超えるか?
The post Dogecoin Price Could Blast Through $0.12 Resistance Is This Technical Pattern Plays Out appeared first on CoinGape.
ドージコインの価格は0.12ドルの抵抗を吹き飛ばす可能性があるこのテクニカルパターンは展開するという投稿は、CoinGapeに最初に掲載されました。
 U_Today
 Thecoinrepublic.com
 DogeHome
 Optimisus
 Optimisus
 DeFi Planet
 Crypto Daily™
 BlockchainReporter
 TheCoinrise Media


