The bloody outlook across the crypto market resulted in a 7% nosedive in Dogecoin price in a week, following an impressive rally above $0.1.
暗号通貨市場全体の血みどろの見通しにより、ドージコイン価格は0.1ドルを超える目覚ましい上昇に続き、1週間で7%急落しました。
This marked the biggest correction since the Q3 rally kicked off in October, with DOGE retracing from $0.105 to trade at $0.092 during the US session on Wednesday.
これは10月に第3四半期のラリーが始まって以来最大の調整となり、水曜日の米国取引ではDOGEは0.105ドルから0.092ドルで取引された。
How Will Dogecoin Price React To FOMC Meeting
ドージコインの価格はFOMC会議にどう反応するか
Bitcoin, Ethereum, and cryptocurrency majors remain suppressed ahead of the Federal Open Market Committee (FOMC) on Wednesday.
水曜日の連邦公開市場委員会(FOMC)を前に、ビットコイン、イーサリアム、仮想通貨大手は引き続き抑制されている。
The Federal Reserve is widely expected to keep interest rates unchanged and provide insight as to when rate cuts could begin, especially with the recently released Consumer Price Index (CPI) data showing that inflation continues to ease.
特に最近発表された消費者物価指数(CPI)データがインフレが引き続き緩和していることを示していることから、FRBは金利を据え置き、利下げ開始時期についての洞察を提供すると広く期待されている。
Unchanged interest rates in the range of 5.25% – 5.50% are positive for risk assets like Bitcoin and Dogecoin while comments on rate cuts could prop the market for a rally.
5.25%~5.50%の範囲で金利が据え置かれているのは、ビットコインやドージコインなどのリスク資産にとってプラスとなる一方、利下げに関するコメントが市場の上昇を促す可能性がある。
Recommended for you: Solana Price Prediction: SOL Plunges 7% Ahead Of Fed Meeting On Interest Rates, What’s Next
あなたにおすすめ: Solana 価格予測: SOL は金利に関する FRB 会合を前に 7% 急落、次は何になるのか
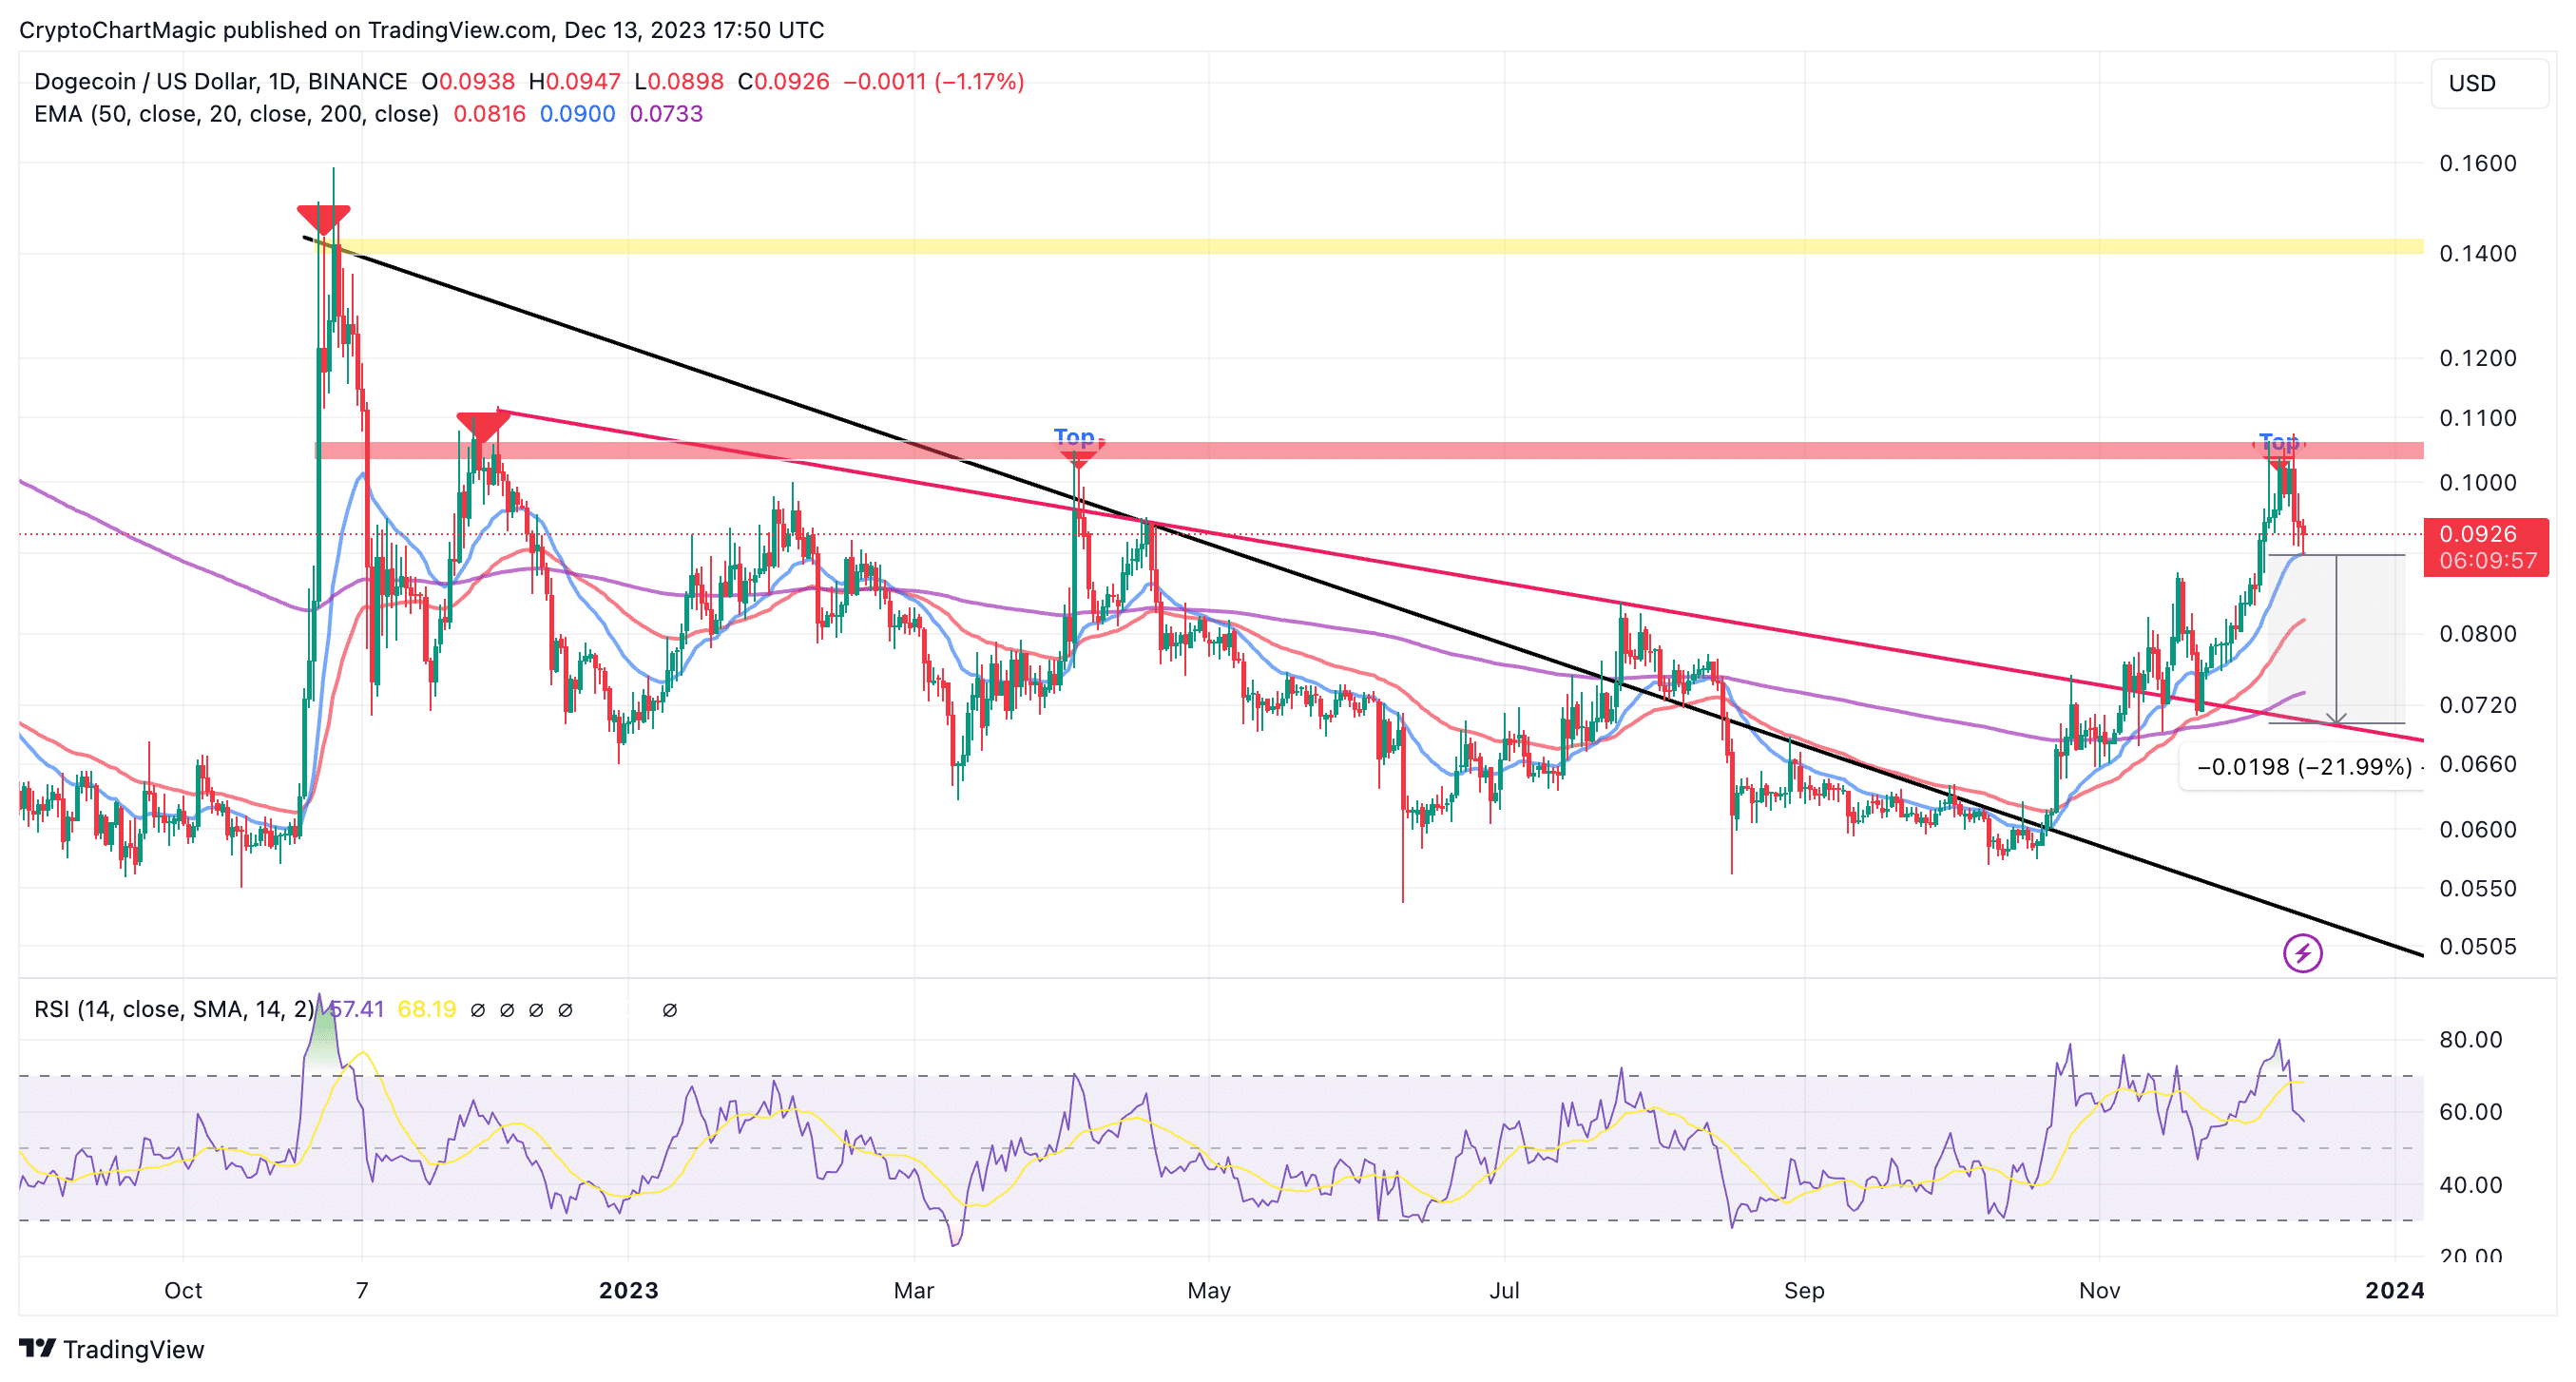
Dogecoin price holds above an important MA—the 20-day Exponential Moving Average (EMA) (in blue). A buoyant DOGE above this level would mean an incoming rebound.
ドージコインの価格は重要なMA、つまり20日間の指数移動平均(EMA)(青)を上回っています。 DOGEがこのレベルを超えて上昇している場合は、リバウンドが起こることを意味します。
However, losing the 20-day EMA as support which currently holds at $0.0929 may lead to a breakdown in such a way that Dogecoin price would be forced to retest other key levels like the 50-day EMA (in red) at $0.0817 and the 200-day EMA (in purple) at $0.0733 on the way to the local support, as highlighted by the descending trendline in in red.
ただし、現在0.0929ドルに維持されている20日間EMAをサポートとして失うと、ドージコイン価格が0.0817ドルの50日間EMA(赤色)や200日間EMA(赤色)などの他の重要なレベルを再テストすることを余儀なくされるようなブレイクダウンにつながる可能性があります。 -日EMA(紫色)はローカルサポートに向かう途中の0.0733ドルで、赤色の下降トレンドラインで強調表示されています。

The Relative Strength Index (RSI) reveals that sellers hold the reins at the moment, with Dogecoin likely to change the trend or continue spiraling while searching for solid support.
相対力指数(RSI)は、現時点では売り手が手綱を握っていることを明らかにしており、ドージコインはトレンドを変えるか、強固なサポートを探しながらスパイラルを続ける可能性が高いです。
A bearish crossover in the RSI confirms the bearish narrative. However, DOGE could quickly snap out of the downtrend if the 21-day support holds.
RSIの弱気クロスオーバーは弱気の物語を裏付けています。しかし、21日間のサポートが維持されれば、DOGEはすぐに下降トレンドから抜け出す可能性がある。
Traders would be on the lookout for a bounce towards the pivotal $0.1 level. A successful retest of this resistance would assure investors of the strengthening bullish theory for gains above hurdles at $0.14 and $0.2, respectively.
トレーダーらは極めて重要な0.1ドル水準への反発に注目しているだろう。この抵抗線の再テストが成功すれば、投資家はそれぞれ0.14ドルと0.2ドルのハードルを超えて上昇する強気理論の強化を確信することになるだろう。
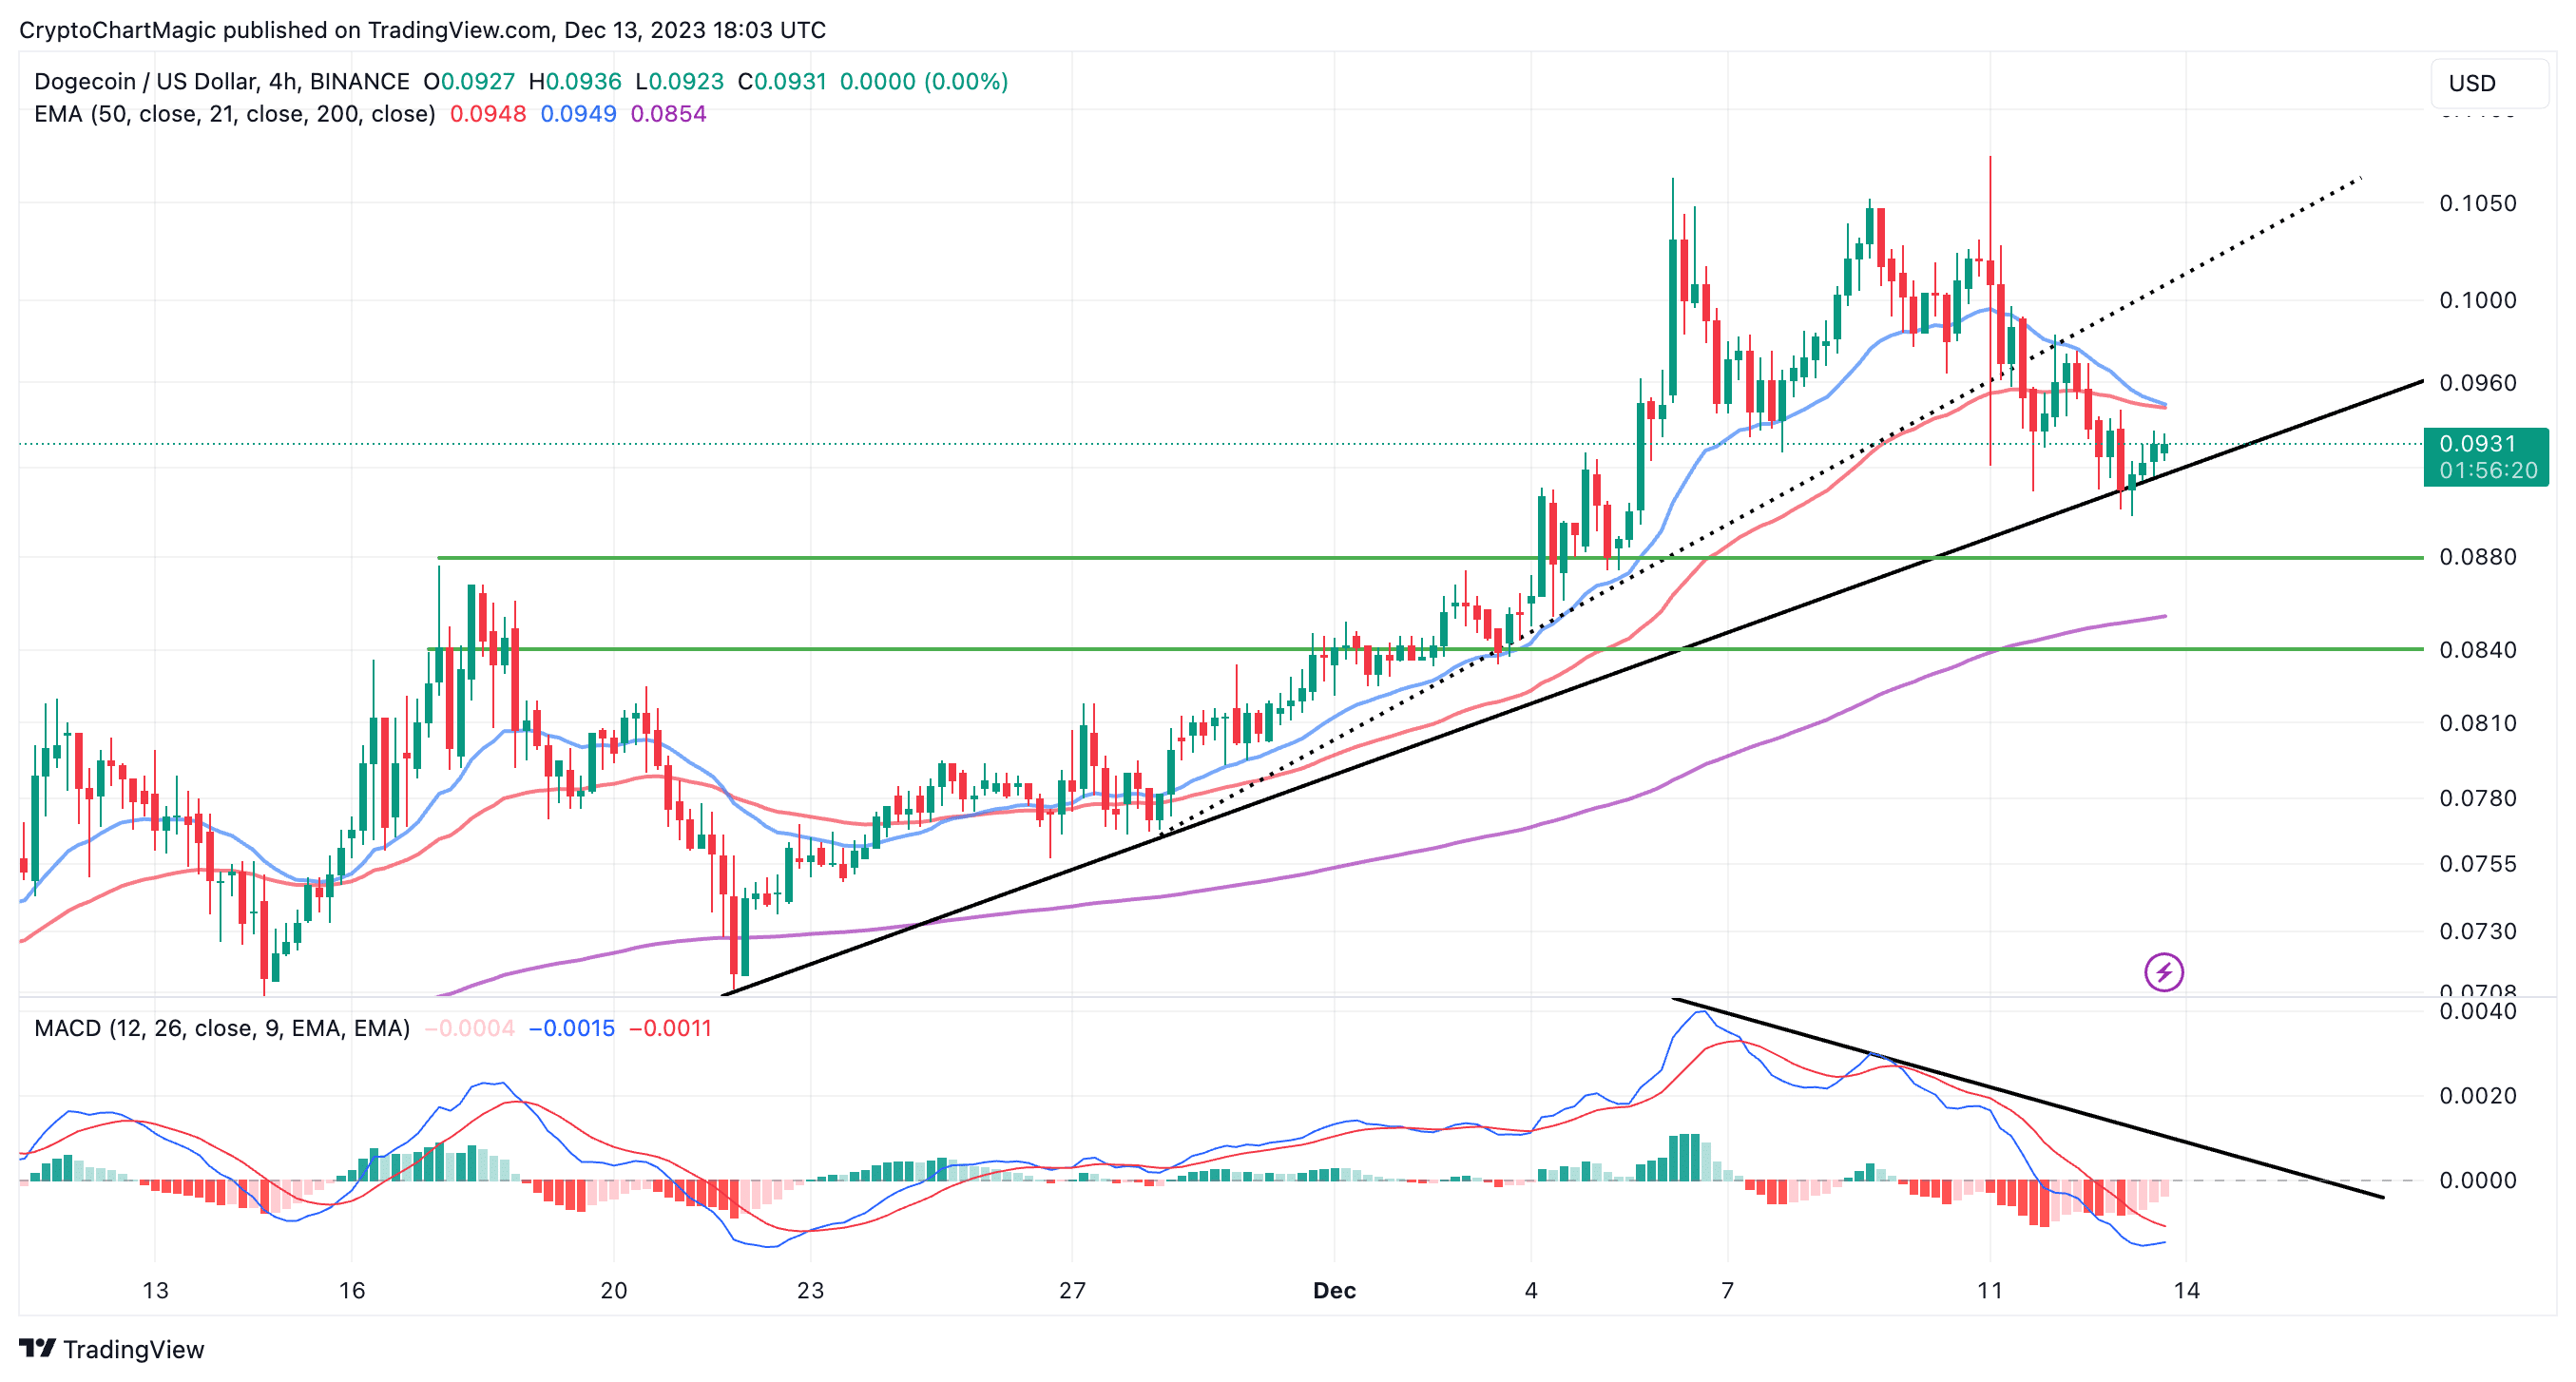
Bulls have already started pushing for a recovery in shorter time frames like the four-hour chart, where Dogecoin is bouncing from the black ascending trendline.
強気派はすでに4時間足チャートのような短い時間枠での回復を目指し始めており、ドージコインは黒い上昇トレンドラインから反発しています。
Although the RSI is not oversold in this time frame, a recovery from support at 40 seems likely. Therefore, it may be prudent for traders to prepare to enter long positions with short-term targets at $0.1 and $0.12, respectively.
RSIはこの時間枠では売られすぎてはいませんが、40のサポートから回復する可能性は高いと思われます。したがって、トレーダーにとっては、短期目標をそれぞれ 0.1 ドルと 0.12 ドルにしてロングポジションをエントリーする準備をすることが賢明かもしれません。

The Moving Average Convergence Divergence (MACD) indicator, although still bearish, has the potential to send a buy signal in this session or the next one.
移動平均収束ダイバージェンス (MACD) 指標はまだ弱気ですが、このセッションまたは次のセッションで買いシグナルを送る可能性があります。
Such a signal will occur as a bullish crossover with the the MACD line in blue moving above the signal line in red. Traders will be inclined to increase exposure to DOGE as the MACD generally moves toward the neutral line and enters the positive area.
このようなシグナルは、青のMACDラインが赤のシグナルラインの上に移動する強気のクロスオーバーとして発生します。 MACDが一般的に中立線に向かって移動し、プラス領域に入ると、トレーダーはDOGEへのエクスポージャーを増やす傾向があります。
Related Articles
関連記事
- Bitcoin Open Interest Rises On Binance & Coinbase Ahead FOMC
- Key Levels to Watch as XRP Price Enters Consolidation Phase
- Bitcoin Price Prediction For 2024, Is BTC Preparing For $100,000?
FOMCを前にバイナンスとコインベースでビットコイン建玉が上昇
XRP価格が統合フェーズに入る際に注目すべき主要なレベル
2024年のビットコイン価格予測、BTCは10万ドルの準備はできているのか?
The post Dogecoin Price 7% Dump in a Week Signals 22% Death Dive for DOGE? appeared first on CoinGape.
投稿 ドージコインの価格が1週間で7%急落、DOGEの22%の急落を示唆?最初に CoinGape に登場しました。


 DogeHome
 Cryptopolitan
 crypto.ro English
 Crypto News Land
 ETHNews
 CFN
CFN U_Today


