Dogecoin is showing positive signs above the $0.0750 resistance against the US Dollar. DOGE could rally over 10% if it clears the $0.0812 resistance zone.
ドージコインは対米ドルで0.0750ドルの抵抗線を超えて明るい兆候を示している。 DOGEが0.0812ドルのレジスタンスゾーンを突破できれば、10%以上上昇する可能性がある。
- DOGE started a decent increase above the $0.0750 resistance against the US dollar.
- The price is trading above the $0.0785 level and the 100 simple moving average (4 hours).
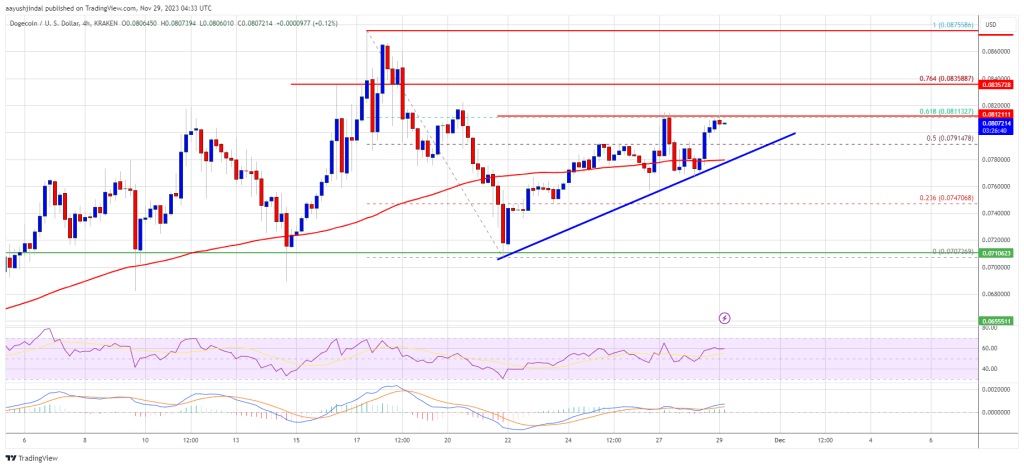
- There is a key bullish trend line forming with support near $0.0792 on the 4-hour chart of the DOGE/USD pair (data source from Kraken).
- The price could start a strong rally like Solana if it clears the $0.0812 resistance.
DOGEは対米ドルで0.0750ドルの抵抗線を超えてまともな上昇を開始した。
価格は0.0785ドルのレベルと100単純移動平均(4時間)を上回って取引されている。
DOGE/USDペアの4時間足チャートには、0.0792ドル付近でサポートを形成する主要な強気トレンドラインが存在する(データソースはKraken)。
0.0812ドルの抵抗線を越えれば、価格はソラナのように力強い上昇を始める可能性がある。
Dogecoin Price Eyes Fresh Rally
ドージコインの価格が新たな上昇に注目
After forming a base above the $0.070 level, Dogecoin price started a fresh increase. DOGE broke the $0.0725 resistance zone to move into a positive zone, like Bitcoin and Ethereum.
0.070ドルレベルを超えるベースを形成した後、ドージコインの価格は新たな上昇を開始しました。 DOGEは0.0725ドルのレジスタンスゾーンを突破し、ビットコインやイーサリアムと同様にプラスゾーンに移行しました。
The bulls were able to push the price further above the $0.0750 resistance. There was a clear move above the 50% Fib retracement level of the downward move from the $0.0875 swing high to the $0.0707 low. However, the price seems to be struggling near the $0.0812 resistance.
強気派は価格を0.0750ドルの抵抗線をさらに上に押し上げることができた。 0.0875ドルのスイング高値から0.0707ドルの安値までの下降の50%Fibリトレースメントレベルを超える明らかな動きがありました。しかし、価格は0.0812ドルの抵抗線付近で苦戦しているようだ。
DOGE is now trading above the $0.0785 level and the 100 simple moving average (4 hours). There is also a key bullish trend line forming with support near $0.0792 on the 4-hour chart of the DOGE/USD pair.
DOGEは現在、0.0785ドルのレベルと100単純移動平均(4時間)を上回って取引されている。 DOGE/USDペアの4時間足チャートでは、0.0792ドル付近にサポート線を形成する重要な強気トレンドラインも存在する。
On the upside, the price is facing resistance near the $0.0812 level. It is close to the 61.8% Fib retracement level of the downward move from the $0.0875 swing high to the $0.0707 low. The next major resistance is near the $0.0835 level.
上値では、価格は0.0812ドル付近の抵抗線に直面している。これは、0.0875ドルのスイング高値から0.0707ドルの安値までの下降の61.8%Fibリトレースメントレベルに近い。次の主要な抵抗線は0.0835ドルレベル付近です。
Source: DOGEUSD on TradingView.com
出典: TradingView.comのDOGEUSD
A close above the $0.0835 resistance might send the price toward the $0.088 resistance. The next major resistance is near $0.0920. Any more gains might send the price toward the $0.095 level.
終値が0.0835ドルの抵抗線を上回った場合、価格は0.088ドルの抵抗線に向かう可能性があります。次の主要な抵抗線は0.0920ドル付近だ。さらに上昇すると、価格は0.095ドルのレベルに向かう可能性があります。
Are Dips Supported in DOGE?
DOGE ではディップがサポートされていますか?
If DOGE’s price fails to gain pace above the $0.0812 level, it could start a downside correction. Initial support on the downside is near the $0.0792 level and the trend line.
DOGEの価格が0.0812ドルのレベルを超えてペースを上げることができなければ、下値修正が始まる可能性がある。下値の最初のサポートは0.0792ドルのレベルとトレンドライン付近にある。
The next major support is near the $0.0770 level. If there is a downside break below the $0.0770 support, the price could decline further. In the stated case, the price might decline toward the $0.0710 level.
次の主要なサポートは0.0770ドルレベル付近です。 0.0770ドルのサポートを下回る下値ブレイクがあれば、価格はさらに下落する可能性がある。上記のケースでは、価格は 0.0710 ドルのレベルに向かって下落する可能性があります。
Technical Indicators
テクニカル指標
4 Hours MACD – The MACD for DOGE/USD is now gaining momentum in the bullish zone.
4時間MACD – DOGE/USDのMACDは現在、強気ゾーンで勢いを増しています。
4 Hours RSI (Relative Strength Index) – The RSI for DOGE/USD is now above the 50 level.
4 時間足 RSI (相対力指数) – DOGE/USD の RSI は現在 50 レベルを超えています。
Major Support Levels – $0.0792, $0.0770, and $0.0710.
メジャーサポートレベル – $0.0792、$0.0770、および $0.0710。
Major Resistance Levels – $0.0812, $0.0835, and $0.0880.
主要な抵抗レベル – 0.0812 ドル、0.0835 ドル、0.0880 ドル。


 DogeHome
 TheCoinrise Media
 Thecoinrepublic.com
 TheCoinrise Media
 TheCoinrise Media
 Cryptopolitan_News
 Coin Edition
 BlockchainReporter


