

Dogecoin Price Analysis
Dogecoin価格分析
In the past 24 hours, the Dogecoin price has declined over 3%, trading at $0.2508 at 10:46 p.m. EST. This drop is attributed to investors shifting their focus to other cryptocurrencies.
過去24時間で、Dogecoinの価格は3%以上減少し、午後10時46分に0.2508ドルで取引されました。 EST(東部基準時。このドロップは、投資家が他の暗号通貨に焦点を移したことに起因します。
Despite this setback, renowned trader and analyst Ali Martinez believes the meme coin could still rally towards $10. In a February 6 post to his followers, he noted that "momentum is building" for Dogecoin and that the bullish scenario remains possible as long as the crypto holds above $0.19.
このset折にもかかわらず、有名なトレーダーでアナリストのアリ・マルティネスは、ミームのコインが10ドルに引き上げることができると考えています。 2月6日のフォロワーへの投稿で、彼はDogecoinの「勢いが構築されている」と述べ、Cryptoが0.19ドルを超えている限り、強気のシナリオは依然として可能であると述べました。
Dogecoin Price Hovering Above Support
ドッグコインの価格は、サポートを上回っています
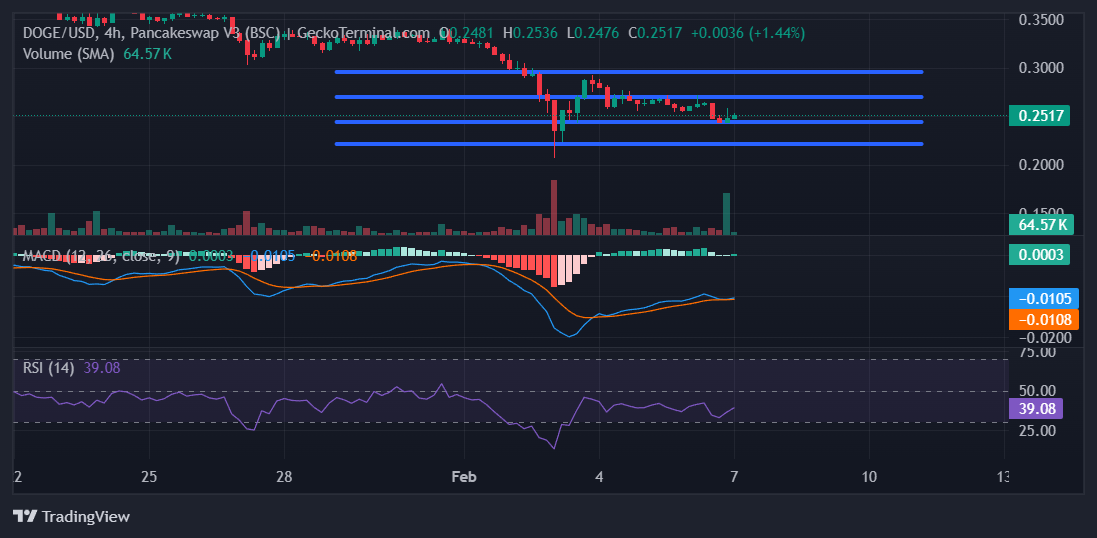
4-hour chart for DOGE/USD (Source: GeckoTerminal)
Doge/USDの4時間チャート(出典:Geckoterminal)
According to GeckoTerminal data, the Dogecoin price is currently hovering above a key support level at $0.2443. If DOGE falls below this level within the next 8 hours, it could potentially drop further to $0.2232.
Geckoterminalのデータによると、Dogecoinの価格は現在、0.2443ドルの主要なサポートレベルを超えています。 Dogeが次の8時間以内にこのレベルを下回ると、さらに0.2232ドルになる可能性があります。
On the other hand, a rebound from $0.2443 could lead to an attempt at challenging the resistance level at $0.2720. Overcoming this obstacle could push the meme coin as high as $0.2945.
一方、0.2443ドルからのリバウンドは、抵抗レベルに0.2720ドルに挑戦しようとする試みにつながる可能性があります。この障害を克服することで、ミームコインが0.2945ドルになる可能性があります。
Technical Indicators Suggest a Potential Rise
技術指標は、潜在的な増加を示唆しています
4-hour chart technical indicators for DOGE suggest a bullish scenario is likely to unfold in the coming trading day.
DOGEの4時間チャートの技術指標は、今後の取引日に強気のシナリオが展開される可能性が高いことを示唆しています。
- Moving Average Convergence Divergence (MACD): The MACD line is positioned above the MACD Signal line, indicating positive momentum.
- Relative Strength Index (RSI): The RSI has shown an increase in buyer strength. While it's below 50, the positive slope suggests a bullish shift.
Traders should note that the RSI has fluctuated between 30 and 50 in recent days. Confirmation of buyer control would come with an RSI rise above 50.
移動平均収束発散(MACD):MACDラインはMACD信号ラインの上に配置され、正のモメンタムを示します。リラシティブ強度指数(RSI):RSIは買い手の強度の増加を示しています。 50未満ですが、ポジティブスロープは強気のシフトを示唆しています。トレーダーは、RSIが最近30〜50で変動していることに注意する必要があります。バイヤーコントロールの確認は、RSI上昇が50を超えています。
Note on Promotional Content
プロモーションコンテンツに関するメモ
The mention of Meme Index (MEMEX) and its high staking rewards appears to be promotional content and has been filtered out.
Meme Index(Memex)とその高いステーキング報酬についての言及は、プロモーションコンテンツのように見え、除外されています。
 Crypto News Land
 DogeHome
 CFN
CFN BlockchainReporter
 Cryptopolitan_News
 DeFi Planet
 TheCoinrise Media
 CoinoMedia


