Dogecoin Price Jumps 4% on Musk's DOGE-Related Comments
マスク氏のDOGE関連のコメントでドージコインの価格が4%上昇
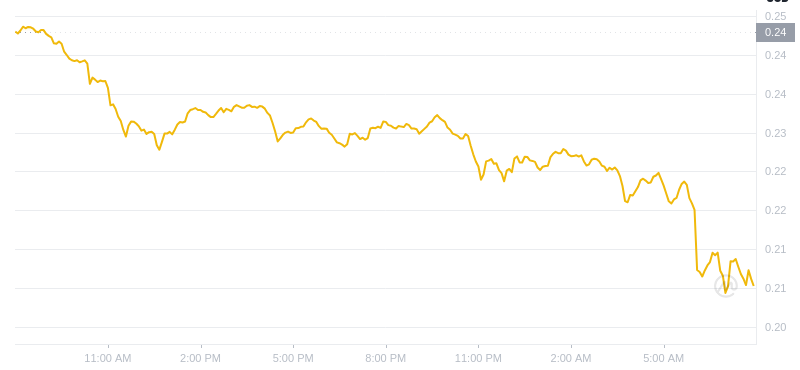
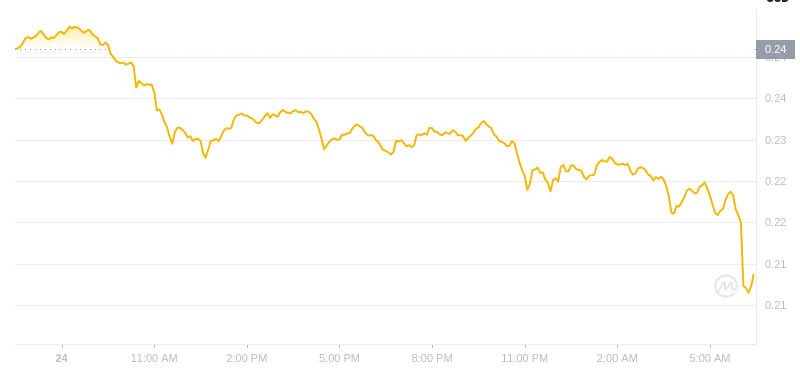
The Dogecoin (DOGE) price has surged by 4% in the past 24 hours, reaching $0.1434 as of 03:43 a.m. EST. This rise is accompanied by a significant 95% increase in trading volume to $1.56 billion.
ドージコイン(DOGE)の価格は過去24時間で4%上昇し、東部時間午前3時43分の時点で0.1434ドルに達した。この上昇に伴い、取引高も95%増の15億6,000万ドルと大幅に増加しました。
Elon Musk's Influence
イーロン・マスクの影響
Elon Musk's recent statement regarding his proposed Department of Government Efficiency (DOGE) has contributed to Dogecoin's price growth. Musk indicated that he would lead this department if Donald Trump wins the upcoming US presidential election.
イーロン・マスク氏の提案した政府効率省(DOGE)に関する最近の声明は、ドージコインの価格上昇に貢献した。マスク氏は、ドナルド・トランプ氏が次期米大統領選挙で勝利した場合、同部門を率いることになると示唆した。
While Musk's comments did not directly mention DOGE, the acronym for the department has often buoyed the coin's value.
マスク氏のコメントはDOGEについて直接言及していなかったが、同省の頭字語がコインの価値を高めることがよくあった。
Dogecoin Price Outlook
ドージコインの価格見通し
After a period of consolidation, DOGE entered a bullish phase, moving from $0.108 to $0.1458. The $0.1458 level is currently acting as resistance, but the price continues to trade within a sideways pattern.
保ち合い期間の後、DOGEは強気局面に入り、0.108ドルから0.1458ドルに上昇しました。現在、0.1458ドルのレベルが抵抗線として機能しているが、価格は横ばいのパターン内で推移している。
Bulls are targeting a breakout above the resistance zone, as DOGE currently trades above both the 50-day and 200-day Simple Moving Averages (SMA).
DOGEは現在、50日と200日の単純移動平均線(SMA)の両方を上回って取引されているため、強気派はレジスタンスゾーンを超えるブレイクアウトを狙っている。
Technical indicators, such as the Relative Strength Index (RSI) and the Moving Average Convergence Divergence (MACD), suggest moderate bullish momentum without overextension.
相対力指数 (RSI) や移動平均収束ダイバージェンス (MACD) などのテクニカル指標は、行き過ぎのない適度な強気の勢いを示唆しています。
Dogecoin Price Prediction
ドージコイン価格予測
The DOGE/USD chart analysis indicates a continued rally for Dogecoin. A breakout above $0.1450 with increased volume would signal a continuation of the uptrend, potentially targeting $0.1572 or higher.
DOGE/USD チャート分析は、ドージコインの上昇が続いていることを示しています。出来高が増加して0.1450ドルを上抜けた場合は上昇トレンドの継続を示し、0.1572ドル以上を目指す可能性がある。
However, if the price fails to break above this level, a pullback towards $0.12 (200-day SMA) could occur. A break below this support would suggest a short-term trend reversal.
ただし、価格がこのレベルを超えられない場合は、0.12 ドル (200 日 SMA) への反落が発生する可能性があります。このサポートを下回ると、短期的なトレンドの反転が示唆されるでしょう。


 TheNewsCrypto
 Times Tabloid
 DogeHome
 CFN
CFN Crypto Daily™
 DogeHome
 Crypto Daily™
 TheCoinrise Media
 Crypto Daily™


