Dogecoin Primed for a Bullish Rally, Suggests Elliott Wave Theory
強気の集会の準備ができているドッグコインは、エリオットウェーブ理論を示唆しています
According to Elliott Wave theory, Dogecoin (DOGE) may be preparing for a significant price surge. An analysis by expert trader Big Mike (@Michael_EWpro) indicates that DOGE could potentially reach $2.43 in the coming months. If this projection holds true, it would mark a substantial price increase for the cryptocurrency since its 2021 high.
エリオットウェーブ理論によると、ドゲコイン(DOGE)は大幅な価格の急増の準備をしている可能性があります。専門家トレーダーのビッグマイク(@michael_ewpro)による分析は、Dogeが今後数か月で潜在的に2.43ドルに達する可能性があることを示しています。この投影が当てはまる場合、2021年以降、暗号通貨の価格が大幅に上昇します。
Elliott Wave theory postulates that price movements occur in impulsive surges followed by corrective phases. Dogecoin's current trajectory appears to align with the setup for a bullish Wave (C).
エリオットウェーブ理論は、価格の動きが衝動的な急増で発生すると仮定していると仮定しています。 Dogecoinの現在の軌道は、強気波(C)のセットアップと一致しているように見えます。
Elliott Wave Analysis
エリオットウェーブ分析
Elliott Wave theory offers a structured way of understanding market trends by identifying patterns in price movements. Big Mike's analysis suggests that Dogecoin's historical rise from $0.0020 to $0.68 unfolded as a five-wave impulsive move, labeled as Wave (A). This was followed by an extended correction, or Wave (B), which confined DOGE within a sideways range for over two years.
エリオットウェーブ理論は、価格の動きのパターンを特定することにより、市場動向を理解する構造化された方法を提供します。 Big Mikeの分析は、Dogecoinの歴史的上昇が0.0020ドルから0.68ドルの歴史的上昇が、Wave(A)とラベル付けされた5波の衝動的な動きとして展開されたことを示唆しています。これに続いて、拡張された補正、または波(b)が続き、2年以上にわたって横方向の範囲内にDogeを閉じ込めました。
"After breaking above its 2021 high, DOGE lost momentum," said Big Mike. "But it's now compressing into a wedge formation, which often precedes a strong breakout."
「2021年の高値を超えた後、Dogeは勢いを失いました」とBig Mikeは言いました。 「しかし、今ではウェッジの形成に圧縮されており、それはしばしば強いブレイクアウトに先行しています。」
His chart outlines the potential for a support/resistance flip at the upper trendline. If DOGE holds above this level, it could confirm the end of Wave (B) and initiate the next upward impulse—Wave (C)—with a target of $2.43.
彼のチャートは、上部トレンドラインでのサポート/抵抗フリップの可能性を概説しています。 Dogeがこのレベルを超えると、波の終わり(b)を確認し、2.43ドルの目標を使用して、次の上向きの衝動(波(c))を開始できます。
Fibonacci Levels and Indicator Support
フィボナッチのレベルとインジケータサポート
Key Fibonacci retracement and extension levels often serve as guidelines for Elliott Wave projections. In the case of Dogecoin, historical price movements have closely aligned with these Fibonacci markers. Big Mike's analysis identifies the $2.36–$2.43 range as a major target based on these ratios.
重要なフィボナッチのリトレースメントと拡張レベルは、多くの場合、エリオット波投影のガイドラインとして機能します。 Dogecoinの場合、歴史的な価格の動きはこれらのフィボナッチマーカーと密接に一致しています。 Big Mikeの分析では、これらの比率に基づいて、2.36〜2.43ドルの範囲を主要なターゲットとして特定しています。
Additionally, other indicators, such as the Ichimoku Cloud, suggest that DOGE's price is building momentum. The Ichimoku Cloud, a technical analysis tool often used to assess trend direction and momentum, has been hovering around current levels. This reinforces the idea that Dogecoin may be consolidating before a breakout.
さらに、一辺雲などの他の指標は、Dogeの価格が勢いを増していることを示唆しています。トレンドの方向と勢いを評価するためによく使用されるテクニカル分析ツールである一方的なクラウドは、現在のレベルでホバリングしています。これは、ドゲコインがブレイクアウトの前に統合している可能性があるという考えを強化します。
Critical Support and Resistance Levels
重要なサポートと抵抗レベル
While the $2.43 target represents a bullish scenario, there are important support levels to consider on the downside. Big Mike's chart identifies $0.15247 as a key support zone. A pullback to this level could serve as a retest of the descending trendline, potentially leading to a strong bounce. However, a break below it could invalidate the bullish outlook or delay the rally.
2.43ドルの目標は強気のシナリオを表していますが、マイナス面で考慮すべき重要なサポートレベルがあります。 Big Mikeのチャートは、0.15247ドルを主要なサポートゾーンとして識別します。このレベルへのプルバックは、降順のトレンドラインの再テストとして機能し、潜在的に強いバウンスにつながる可能性があります。ただし、その下のブレークは、強気の見通しを無効にしたり、集会を遅らせる可能性があります。
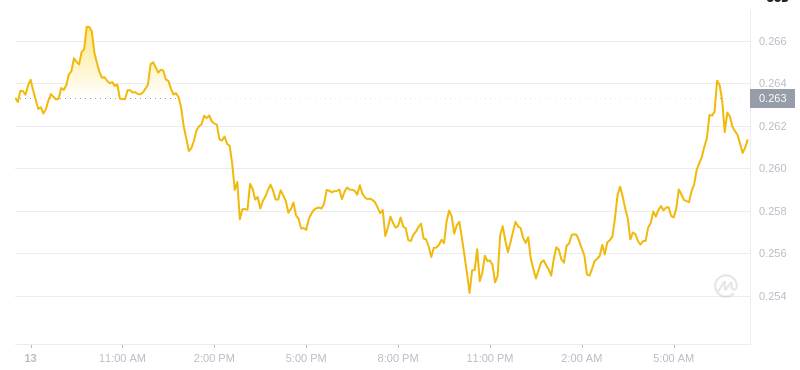
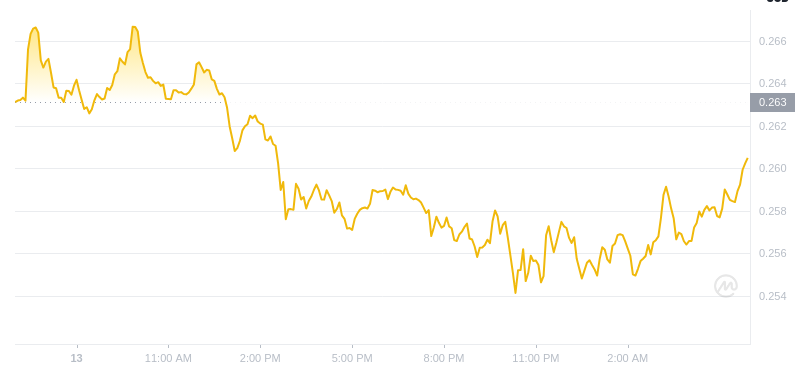
Dogecoin is currently trading around $0.25. Maintaining this range and breaking above the upper trendline could signal the start of Wave (C), bringing the $2.43 target into view.
Dogecoinは現在、約0.25ドルを取引しています。この範囲を維持し、上部トレンドラインを上回ると、波の始まり(c)を示す可能性があり、2.43ドルのターゲットを視野に入れることができます。
Technical Analysis Signals Potential
テクニカル分析は可能性を示します
Dogecoin's current market position underscores the importance of meticulous technical analysis. While Elliott Wave theory does not provide guarantees, it offers a structured approach to anticipating market movements. If Big Mike's projection materializes, Dogecoin could gain renewed attention and investment, solidifying its position in the cryptocurrency market.
Dogecoinの現在の市場の位置は、細心の技術分析の重要性を強調しています。エリオットウェーブ理論は保証を提供しませんが、市場の動きを予測するための構造化されたアプローチを提供します。 Big Mikeの予測が実現した場合、Dogecoinは新たな注意と投資を得ることができ、暗号通貨市場での地位を強化することができます。
It's essential to note that investors should approach all forecasts with caution. External factors, such as market sentiment and macroeconomic conditions, can impact DOGE's trajectory. Nevertheless, the combination of Elliott Wave theory, Fibonacci levels, and key technical indicators provides a compelling roadmap for the months ahead.
投資家はすべての予測に注意してアプローチする必要があることに注意することが不可欠です。市場の感情やマクロ経済条件などの外部要因は、Dogeの軌跡に影響を与える可能性があります。それにもかかわらず、エリオットウェーブ理論、フィボナッチレベル、および主要な技術指標の組み合わせは、今後数か月間、説得力のあるロードマップを提供します。
Eyes on $2.43
2.43ドルの目
Dogecoin's Elliott Wave chart suggests the potential for a substantial rally towards $2.43. While this outcome is not certain, the technical patterns and key levels outlined by experts like Big Mike create a clear framework for traders and investors. If DOGE can confirm a breakout above its current consolidation range, the stage may be set for a bullish Wave (C) that could propel the cryptocurrency to new heights. Keep following updates and developments on Dogecoin and other cryptocurrencies.
DogecoinのElliott Waveチャートは、2.43ドルに相当な集会の可能性を示唆しています。この結果は確かではありませんが、ビッグマイクのような専門家によって概説されている技術的パターンと重要なレベルは、トレーダーや投資家のための明確なフレームワークを作成します。 Dogeが現在の統合範囲を超えるブレイクアウトを確認できる場合、暗号通貨を新しい高みに推進する可能性のある強気波(c)にステージが設定される場合があります。 Dogecoinおよびその他の暗号通貨の更新と開発をフォローし続けてください。
Glossary
用語集
- Elliott Wave Theory: A market analysis method that identifies recurring price patterns based on investor psychology and market cycles.
- Wave (A), (B), (C): In Elliott Wave terminology, a three-wave structure consisting of an initial impulsive move (A), a corrective phase (B), and a final impulsive wave (C).
- Fibonacci Levels: Ratios used in technical analysis to identify potential support and resistance levels, derived from the Fibonacci sequence.
- Ichimoku Cloud: A technical indicator that provides a comprehensive view of momentum, trend direction, and support/resistance levels.
- Support/Resistance Flip: A scenario in which a previously resistant level becomes support, or vice versa, indicating a potential change in trend.
エリオットウェーブ理論:投資家心理学と市場サイクルに基づいた繰り返しの価格パターンを識別する市場分析方法。ウェーブ(a)、(b)、(c):エリオット波の用語では、最初の衝動的な動きで構成される3波構造(a)、矯正段階(b)、および最終的な衝動波(c)。フィボナッチレベル:フィボナッチ配列から導出された潜在的なサポートと抵抗レベルを特定するためにテクニカル分析で使用される比率。勢い、トレンドの方向、およびサポート/抵抗レベルの包括的な見解。Support/Resistance Flip:以前の耐性レベルがサポートになる、またはその逆のシナリオ、トレンドの潜在的な変化を示しています。


 Crypto News Land
 The Coin Republic
 TheCoinrise Media
 DogeHome
 TheNewsCrypto
 DogeHome
 Optimisus
 DT News
 Optimisus


