Dogecoin Whales Fuel Price Surge
ドージコインクジラの燃料価格高騰
Dogecoin whales have been significantly active following the cryptocurrency's breakout above the 100-day Exponential Moving Average (EMA). As soon as the memecoin crossed this technical threshold, whale activity soared.
ドージコインのクジラは、仮想通貨が100日指数移動平均(EMA)を上回ったことを受けて大きく活発化している。ミームコインがこの技術的閾値を超えるとすぐに、クジラの活動が急増しました。
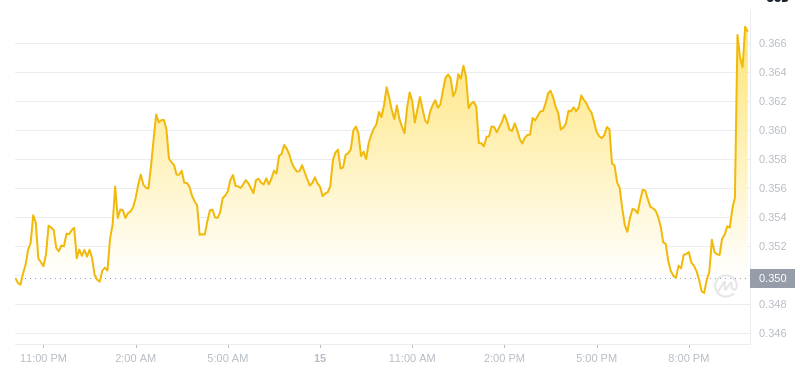
Recent data and charts reveal a strong correlation between the increase in large whale transactions and Dogecoin's price movement. The number and total volume of large transactions spiked as Dogecoin approached $0.13.
最近のデータとチャートは、大規模なクジラ取引の増加とドージコインの価格変動との間に強い相関関係があることを明らかにしています。ドージコインが0.13ドルに近づくにつれ、大規模取引の数と総量は急増した。
In the past day alone, over 1,030 large transactions worth a staggering 6.84 billion DOGE were executed. This activity suggests that large holders may be redistributing their assets or preparing for major market fluctuations.
過去 1 日だけで、68 億 4,000 万 DOGE 相当の 1,030 件以上の大規模取引が実行されました。この活動は、大口保有者が資産を再分配しているか、市場の大きな変動に備えている可能性があることを示唆しています。
The observed correlation between whale activity and Dogecoin's price indicates that whales play a crucial role in the current market dynamics. It's possible that the price crossing the 100-day EMA, a key technical indicator, triggered buy signals for many traders, including these large holders. The surge in whale activity can be seen as both a cause and an effect of the recent price increase.
クジラの活動とドージコインの価格の間に観察された相関関係は、クジラが現在の市場力学において重要な役割を果たしていることを示しています。重要なテクニカル指標である100日EMAを超えた価格が、これらの大口保有者を含む多くのトレーダーにとって買いシグナルを引き起こした可能性がある。クジラの活動の急増は、最近の価格上昇の原因でもあり、結果でもあると考えることができます。
Data analysis suggests several potential outcomes for Dogecoin's future:
データ分析は、Dogecoin の将来についてのいくつかの潜在的な結果を示唆しています。
- If the price remains above the 100-day EMA and approaches the 200-day EMA, it could indicate a sustained bullish trend and attract further buying interest.
- Support levels at the 50-day EMA ($0.127), 100-day EMA ($0.133), and 200-day EMA ($0.128) are key to watch.
- If Dogecoin stays above these levels, it may stabilize and potentially reach higher resistance around $0.15.
- However, if the number of large transactions declines and the price fails to stay above these moving averages, Dogecoin may experience downward pressure.
The Relative Strength Index (RSI) currently indicates a neutral zone, suggesting the market is awaiting clearer signals.
価格が100日EMAを上回り、200日EMAに近づいた場合、持続的な強気トレンドを示し、さらなる購入意欲を集める可能性があります。サポートレベルは50日EMA(0.127ドル)、100日EMA(0.133ドル)です。 、および200日EMA(0.128ドル)が注目の鍵です。ドージコインがこれらのレベルを上回ったままであれば、安定し、0.15ドル付近のより高い抵抗線に達する可能性があります。ただし、大規模な取引の数が減少し、価格がこれらの動きを上回れない場合は、相対力指数(RSI)は現在中立ゾーンを示しており、市場がより明確なシグナルを待っていることを示唆しています。


 InsideBitcoin News
 Crypto Intelligence
 CoinPedia News
 CFN
CFN The Bit Journal
 DogeHome
 CoinPedia News
 Crypto News Flash
 The Bit Journal


