

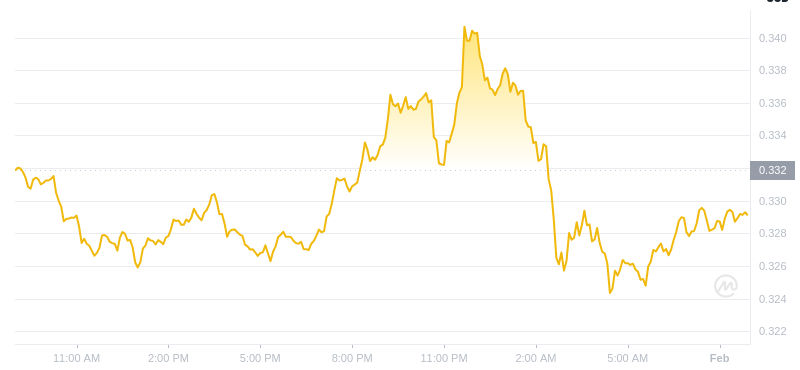
(24-hour Dogecoin price trend)
(24時間のDogecoin価格の傾向)
Dogecoin (DOGE) Price Analysis
Dogecoin(Doge)価格分析
February 1, 2025, 08:00 UTC
2025年2月1日、08:00 UTC
As of the latest update, Dogecoin (DOGE) is trading at $0.32877183842747, experiencing a decline of -0.97525568% in the last 24 hours. The 24-hour trading volume stands at $1791515847.1312.
最新のアップデートの時点で、Dogecoin(Doge)は0.32877183842747ドルで取引されており、過去24時間で-0.97525568%の減少を経験しています。 24時間の取引量は1791515847.1312ドルです。
Key Metrics:
重要な指標:
- Circulating Supply: 147858126383.71
- Maximum Supply: Unlimited
- Total Supply: 147858126383.71
- Market Capitalization: $48611588037.612
Market Movement:
循環供給:147858126383.71maximum Supply:UnlimitedTotal Supply:147858126383.71Market Capitalization:$ 48611588037.612Market Movement:
Over the past 24 hours, Dogecoin's price has seen a slight dip. The asset reached its lowest point at $0.32678012105244 and its highest at $0.33167879184678. This price action suggests that there is some volatility in the market, but the overall trend remains sideways.
過去24時間にわたって、Dogecoinの価格はわずかな低下を見てきました。この資産は、0.32678012105244で最も低い地点に達し、最高のポイントは0.33167879184678ドルでした。この価格アクションは、市場に何らかのボラティリティがあることを示唆していますが、全体的な傾向は横に残っています。
Technical Indicators:
技術指標:
Based on technical indicators, Dogecoin's Relative Strength Index (RSI) is currently at 47.19, indicating that the asset is in a neutral zone. The Moving Average Convergence Divergence (MACD) is also suggesting a lack of clear direction, with the MACD line below the signal line and the histogram showing a flat trend.
技術指標に基づいて、Dogecoinの相対強度指数(RSI)は現在47.19であり、資産が中立ゾーンにあることを示しています。移動平均収束発散(MACD)も明確な方向の欠如を示唆しており、MACDラインは信号線の下にあり、ヒストグラムはフラットな傾向を示しています。
Conclusion:
結論:
The Dogecoin market is currently experiencing some volatility, with the price moving within a narrow range. Technical indicators suggest a lack of clear direction, and traders may want to exercise caution before making any decisions. It is important to monitor the market closely and consider a long-term investment strategy rather than short-term trading.
Dogecoin市場は現在、ある程度のボラティリティを経験しており、価格は狭い範囲内で動いています。技術的指標は明確な方向性の欠如を示唆しており、トレーダーは決定を下す前に注意を払うことをお勧めします。市場を綿密に監視し、短期取引ではなく長期的な投資戦略を検討することが重要です。
 CFN
CFN DogeHome
 CoinPedia News
 Cointelegraph
 DT News
 TheCoinrise
 Optimisus


