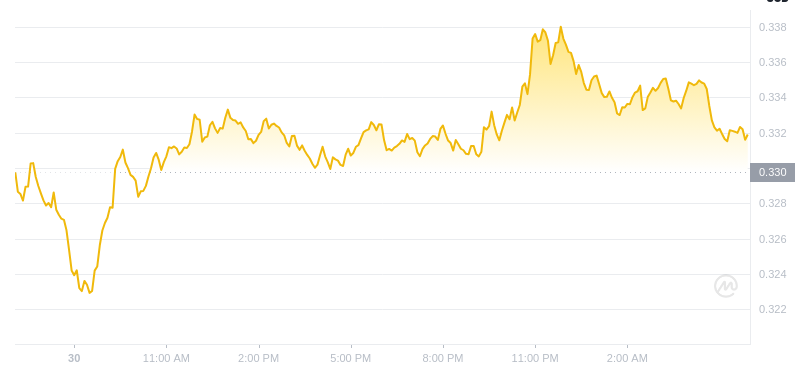
Trader and analyst Ðima James Potts has issued an ambitious forecast for Dogecoin. Potts projects a potential year-end price of $11.65 for Dogecoin in 2025. Moreover, his analysis is rooted in historical price patterns observed during the fourth year of Dogecoin’s previous market cycles.
トレーダー兼アナリストのÐima James Potts氏は、ドージコインについて野心的な予測を発表しました。ポッツ氏は、2025 年のドージコインの潜在的な年末価格は 11.65 ドルになると予測しています。さらに、彼の分析は、ドージコインの以前の市場サイクルの 4 年目に観察された歴史的な価格パターンに基づいています。
Historical Patterns Suggest $11.65 Target for 2025
Potts’ analysis highlights recurring trends in Dogecoin’s fourth-year performance across previous market cycles.
過去のパターンは 2025 年の目標を 11.65 ドルと示唆 ポッツ氏の分析は、ドージコインの 4 年目のパフォーマンスが過去の市場サイクル全体で繰り返し発生する傾向を浮き彫りにしています。
Year four of the first cycle started at $0.00023 and ended at $0.00851, which is a 37x growth. Likewise, the fourth year of the second cycle began at $0.00460 and ended at $0.17064, attaining the same 37x rise.
最初のサイクルの 4 年目は 0.00023 ドルで始まり、0.00851 ドルで終了しました。これは 37 倍の成長です。同様に、第 2 サイクルの 4 年目は 0.00460 ドルで始まり、0.17064 ドルで終わり、同じ 37 倍の上昇を達成しました。
According to Potts, if 2024 ends with Dogecoin priced around $0.315, history suggests that 2025 could close at $11.65—37 times the starting price. Potts emphasized that this projection reflects a year-end target rather than a potential peak price, implying additional upward movement during the year.
ポッツ氏によると、ドージコインの価格が約0.315ドルで2024年が終了した場合、歴史によれば、2025年は開始価格の37倍にあたる11.65ドルで終了する可能性があるという。ポッツ氏は、この予測は潜在的なピーク価格ではなく年末の目標を反映しており、年内のさらなる上昇を示唆していると強調した。
DOGE Price Analysis Indicates Potential for a Breakout
Analyzing the Dogecoin daily price chart on TradingView reveals a consolidation phase following a strong bullish rally in October and early November. DOGE trades around $0.3163.
DOGE価格分析はブレイクアウトの可能性を示すTradingViewでドージコインの日次価格チャートを分析すると、10月から11月初旬にかけての力強い強気上昇に続いて堅調局面にあることが明らかになりました。 DOGEは0.3163ドル付近で取引されている。
During this period, Dogecoin climbed to approximately $0.50000 before retracing, entering a consolidation phase. Support is identified at $0.27500, near the lower Bollinger Band, while resistance lies at $0.36000, suggesting a critical trading range for potential price movements.
この期間中、ドージコインは約0.50000ドルまで上昇し、その後反落し、保ち合い段階に入りました。サポートはボリンジャーバンドの下限付近の0.27500ドルにあり、レジスタンスは0.36000ドルにあり、潜在的な価格変動にとって重要な取引範囲であることを示唆しています。
Reduced volatility is highlighted by narrowing Bollinger Bands, suggesting a potential breakout. Furthermore, a bullish long-term trend is reinforced by the 200-day EMA, which is presently at $0.22485 and offers solid support for the general upward trajectory.
ボラティリティの低下はボリンジャーバンドの幅が狭いことで強調され、ブレイクアウトの可能性を示唆しています。さらに、強気の長期トレンドは、現在 0.22485 ドルにある 200 日 EMA によって強化され、全体的な上昇軌道を確実にサポートします。
Momentum indicators reflect a mixed outlook for Dogecoin’s immediate future. With its present value of 38.73, the RSI is getting close to oversold zone, suggesting a possible price reversal. In the meantime, the MACD indicates waning bearish momentum and the potential for a bullish crossover.
モメンタム指標は、ドージコインの当面の将来に対するさまざまな見通しを反映しています。現在の価値は 38.73 で、RSI は売られ過ぎゾーンに近づいており、価格反転の可能性を示唆しています。一方、MACD は弱気の勢いが弱まり、強気のクロスオーバーの可能性を示しています。


 Crypto Daily™
 Optimisus
 Optimisus
 Optimisus
 CFN
CFN Crypto Daily™
 DogeHome
 Crypto Daily™
 Crypto Daily™


