Bullish Signals for PEPE with Breakout Potential
ブレイクアウトの可能性を秘めたPEPEの強気シグナル
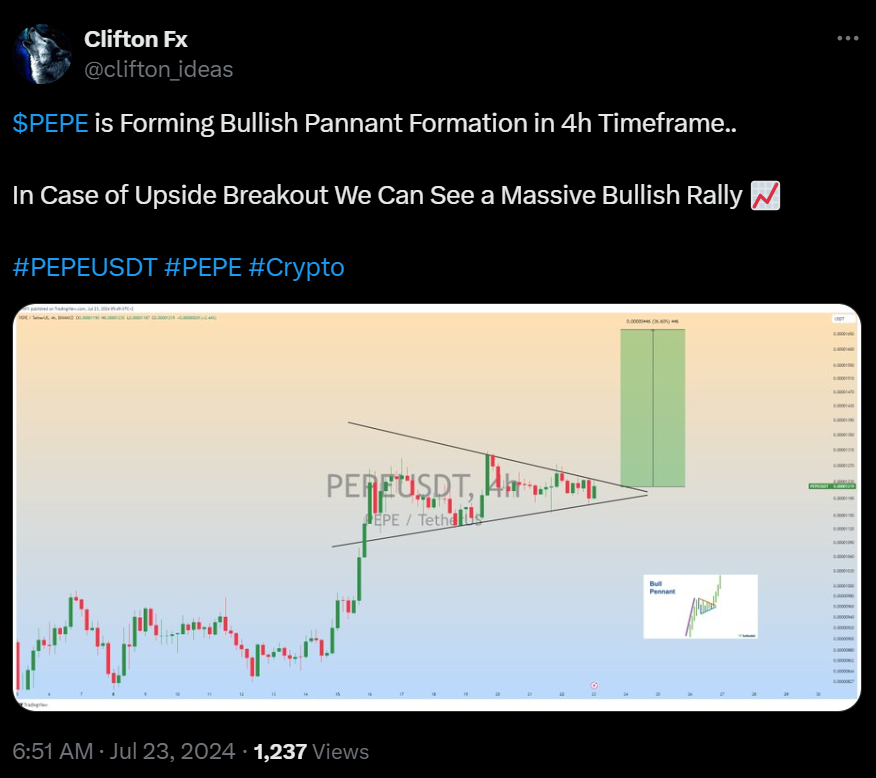
PEPE's bullish pennant formation on the 4-hour chart suggests a potential breakout towards $0.00001650 if resistance at $0.00001350 is overcome.
4時間足チャートにおけるPEPEの強気ペナント形成は、0.00001350ドルの抵抗を克服した場合、0.00001650ドルに向けてブレイクアウトする可能性を示唆しています。
Key support levels for PEPE are at $0.00001190 and $0.00001030. A drop below these levels could indicate a decline.
PEPE の主要なサポート レベルは $0.00001190 と $0.00001030 です。これらのレベルを下回る低下は、衰退を示している可能性があります。
Current indicators show PEPE's Relative Strength Index (RSI) at 54.59 and its Moving Average Convergence Divergence (MACD) above the signal line, suggesting potential short-term bullish momentum.
現在の指標は、PEPEの相対力指数(RSI)が54.59で、移動平均収束ダイバージェンス(MACD)がシグナルラインを上回っていることを示しており、短期的な強気の勢いの可能性を示唆しています。
Analyst Clifton Fx highlights that the PEPE meme coin is displaying promising technical signs, particularly the bullish pennant formation, which suggests further gains after a strong upward movement. The converging trend lines in this pattern create a triangular shape, indicating a potential breakout with significant price movement.
アナリストのクリフトンFX氏は、PEPEミームコインが有望なテクニカル兆候、特に強気のペナント形成を示しており、これは力強い上昇相場の後にさらに上昇することを示唆していると強調している。このパターンの収束トレンド ラインは三角形の形状を作成し、大きな価格変動を伴うブレイクアウトの可能性を示します。


 Cryptopolitan
 DogeHome
 crypto.ro English
 Crypto News Land
 ETHNews
 CFN
CFN U_Today
 Thecoinrepublic.com


