Pepe Coin (PEPE) Price Analysis and Recovery Prospects in May 2024
Pepe Coin (PEPE) 価格分析と2024年5月の回復見通し
Price Market Performance of PEPE
PEPEの価格市場パフォーマンス

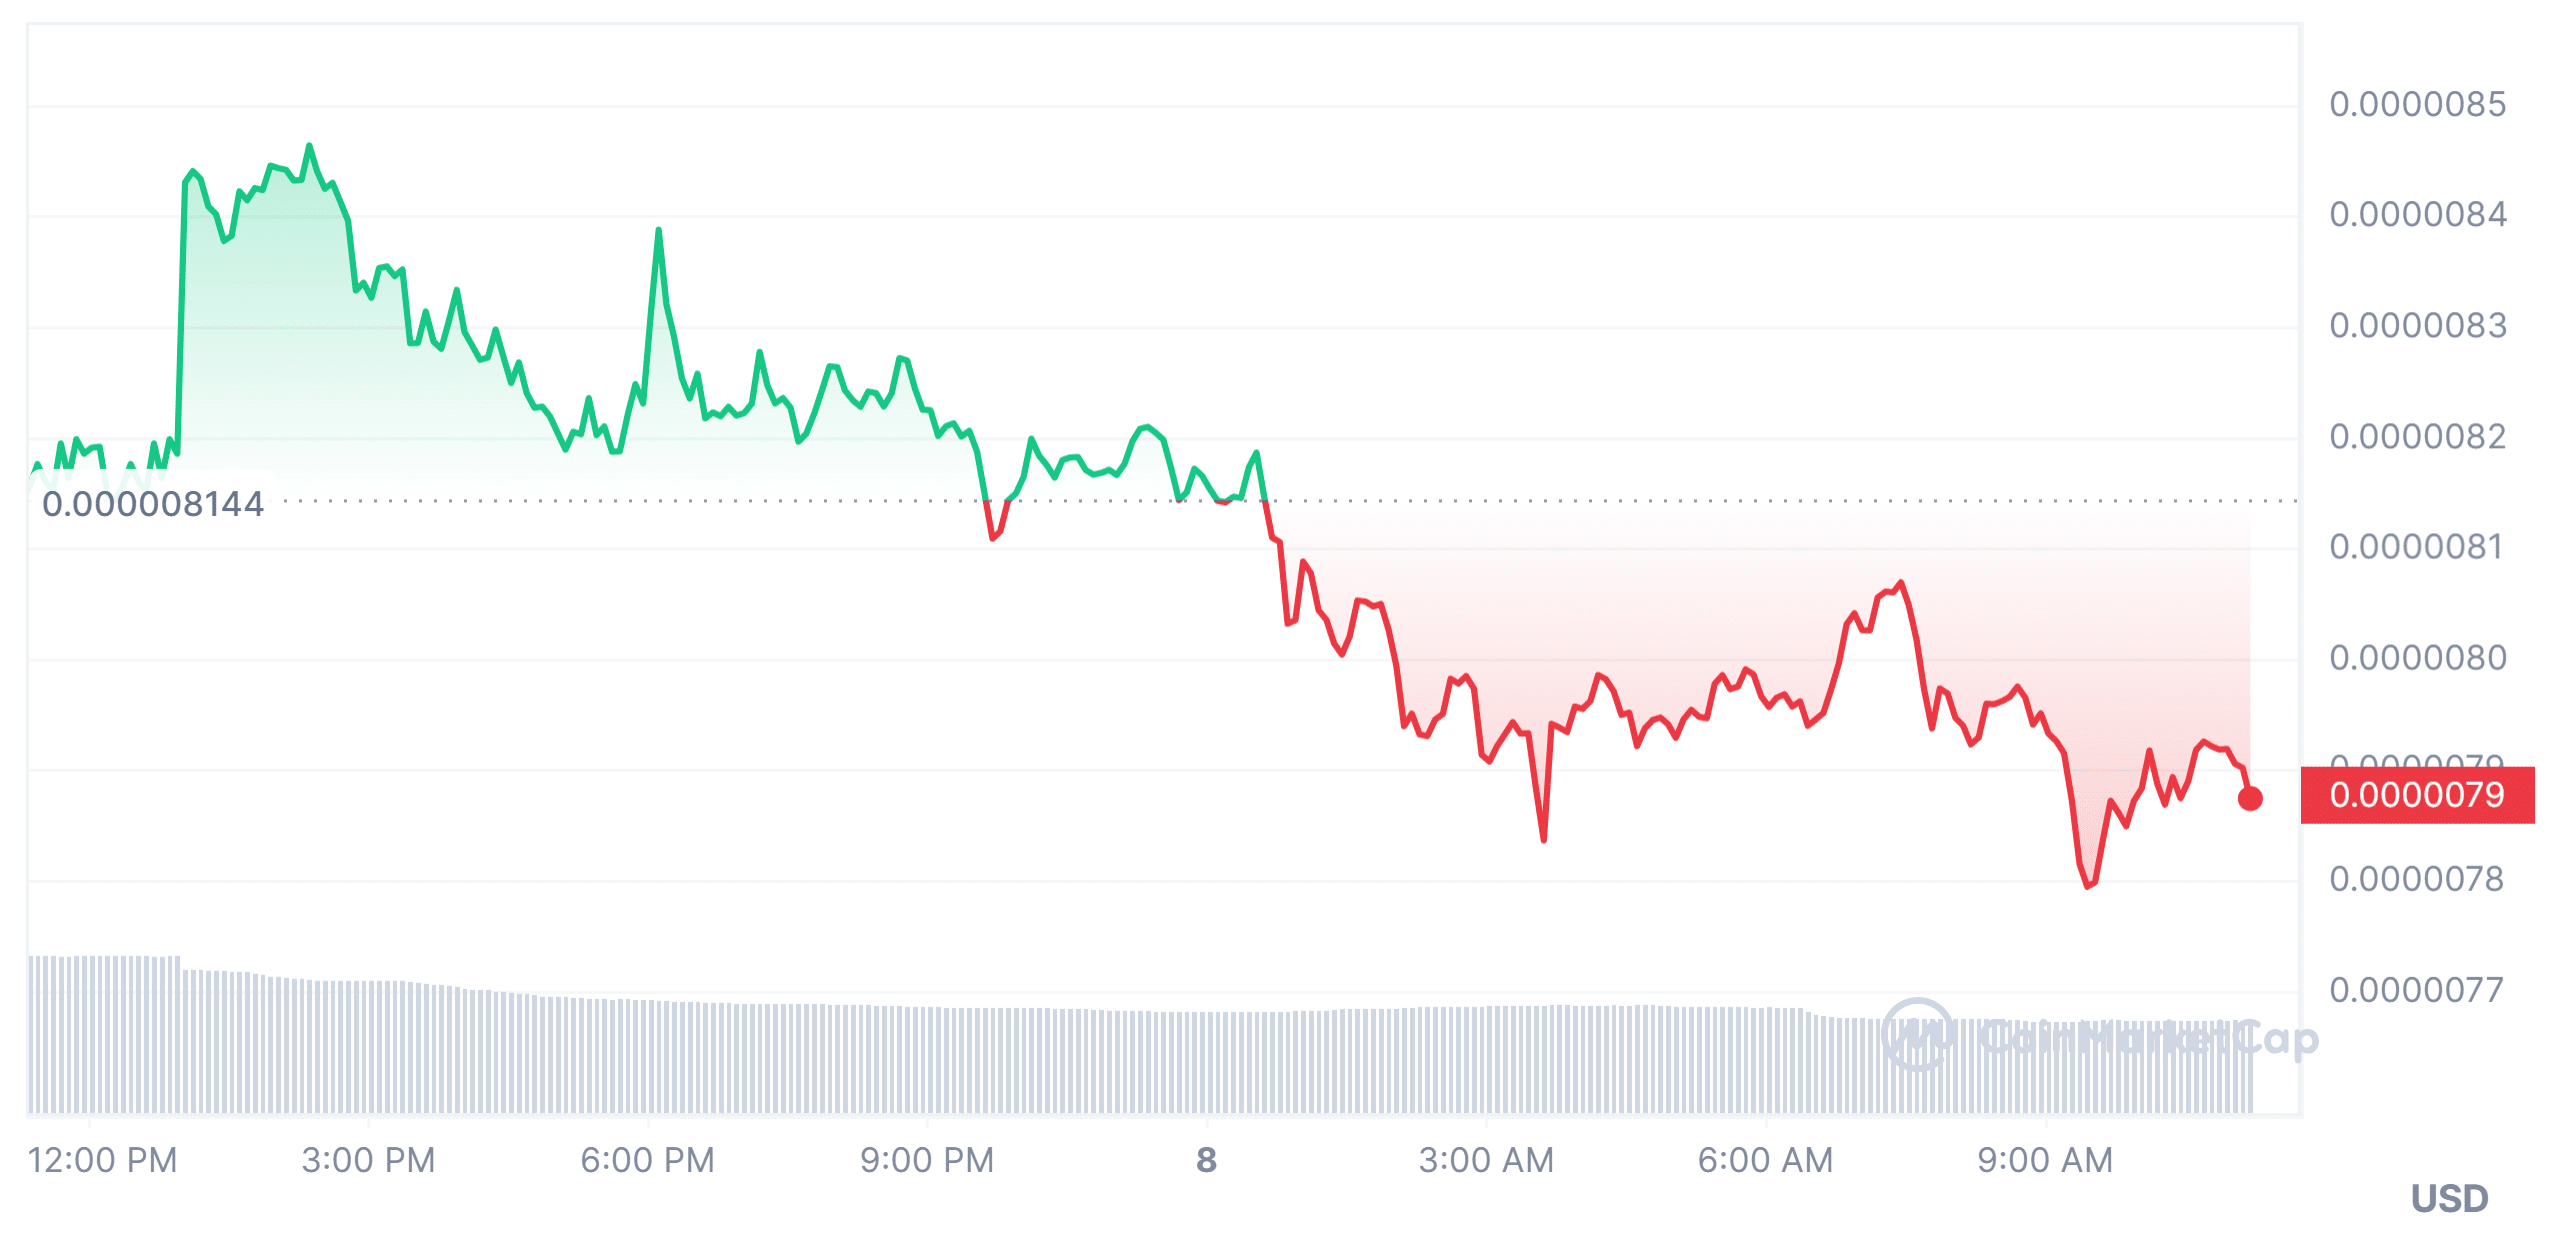
Pepe Coin (PEPE) is currently trading at $0.000007871, a 3.35% drop from the previous day. However, the token has surged by approximately 30.93% over the past week and 4.50% in the past month.
ペペコイン(PEPE)は現在、前日比3.35%下落し、0.000007871ドルで取引されている。しかし、トークンは過去1週間で約30.93%、先月で4.50%急騰しました。
With a market capitalization of $3.31 billion, PEPE ranks 31st among cryptocurrencies. Trading activity has slowed, with a volume of $613.06 million, down 40.15% over the past 24 hours. PEPE reached its all-time high of $0.00001074 on March 14, 2024, but has since retraced by 26.69%.
PEPEの時価総額は33億1,000万ドルで、仮想通貨の中で31位にランクされています。取引活動は鈍化し、出来高は過去24時間で40.15%減の6億1306万ドルとなった。 PEPEは2024年3月14日に史上最高値の0.00001074ドルに達しましたが、その後26.69%値を戻しています。
Reasons for PEPE Price Drop
PEPE価格下落の理由
Recent large token withdrawals from Binance, totaling 1.3 trillion PEPE tokens, have raised concerns among the crypto community. The unknown origins and use of secure wallets have led to speculation about market manipulation or regulatory issues. These withdrawals coincided with a sudden price increase, further unsettling investors. Additionally, significant fund additions to a Binance wallet, suggesting institutional participation, have complicated PEPE's market dynamics.
バイナンスからの最近の大量のトークン引き出し(合計1兆3000億PEPEトークン)は、仮想通貨コミュニティの間で懸念を引き起こしています。不明な起源と安全なウォレットの使用は、市場操作や規制問題に関する憶測につながっています。これらの撤退は突然の価格上昇と同時に発生し、投資家をさらに不安にさせた。さらに、金融機関の参加を示唆するバイナンスウォレットへの大幅な資金追加は、PEPEの市場力学を複雑にしています。
Will Pepe Price Recover in May?
ペペ価格は5月に回復するか?
Technical analysis suggests a positive trend for PEPE in both the short-term and long-term, with a "Buy" signal. EMA and SMA for different time frames indicate a bullish outlook.
テクニカル分析は、短期および長期の両方で PEPE にプラスの傾向があり、「買い」シグナルを示していることを示唆しています。さまざまな時間枠の EMA と SMA は強気の見通しを示しています。
Oscillators show a neutral position. While MACD signals "Buy," Momentum suggests "Sell." The Relative Strength Index (RSI) is balanced, avoiding overbought or oversold zones.
オシレーターは中立位置を示します。 MACD が「買い」を示唆するのに対し、モメンタムは「売り」を示唆します。相対力指数 (RSI) はバランスが取れており、買われすぎまたは売られすぎのゾーンを回避します。
Support levels are located at 0.000004138776 and 0.000001609331, with resistance levels at 0.000008999944 and 0.000011331667.
サポートレベルは0.000004138776と0.000001609331にあり、レジスタンスレベルは0.000008999944と0.000011331667です。
Based on these indicators, PEPE Coin is in a consolidation stage, lacking a clear direction. However, overall sentiment is slightly positive, suggesting a potential trend reversal. Traders can look for confirmation signs such as breaking above resistance levels or consistent price action above key moving averages.
これらの指標に基づくと、PEPE Coinは統合段階にあり、明確な方向性がありません。ただし、全体的なセンチメントはわずかにポジティブであり、傾向が反転する可能性を示唆しています。トレーダーは、レジスタンスレベルを突破したり、主要な移動平均を上回る一貫した価格行動などの確認サインを探すことができます。
Monitoring trading volume alongside technical indicators can provide further insights into the strength of a potential recovery. An increase in trading activity coinciding with price gains would support the bullish argument.
テクニカル指標と合わせて取引高を監視することで、回復の可能性の強さについてさらに洞察を得ることができます。価格上昇と同時に取引活動が増加すれば、強気の議論が裏付けられるだろう。
Despite mixed indicators, the general prediction for PEPE indicates a potential recovery in May 2024, particularly if it can break through crucial resistance levels and sustain its upward trend. However, traders should exercise caution and consider market sentiment and news updates for a comprehensive analysis before making trading decisions.
指標はまちまちだが、PEPEの一般的な予測は、特に重要な抵抗水準を突破して上昇傾向を維持できれば、2024年5月に回復する可能性を示している。ただし、トレーダーは取引の決定を下す前に、慎重に市場センチメントやニュースの最新情報を考慮して包括的な分析を行う必要があります。


 DogeHome
 Optimisus
 Crypto News Land
 Optimisus
 Cryptopolitan_News
 Cryptopolitan


