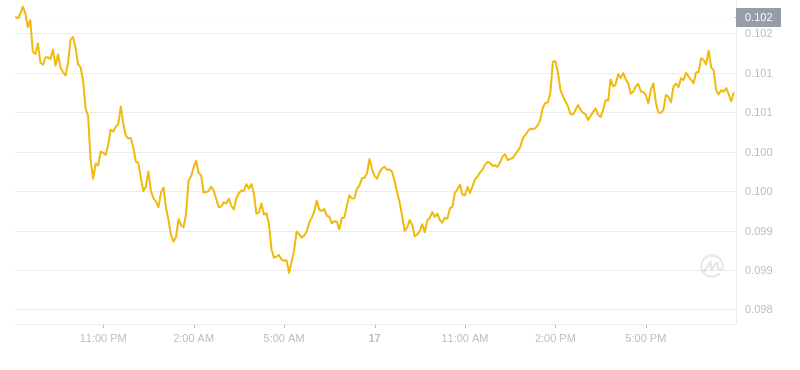
(24-hour Dogecoin price trend)
(ドージコインの24時間価格推移)
Dogecoin Price Analysis: A Dip in Value, Market Cap Fluctuates
ドージコインの価格分析: 価値の下落、時価総額の変動
As of September 17, 2024, at 08:00 PM UTC, the latest price of Dogecoin (DOGE) stood at $0.10075167170007. The 24-hour trading volume amounted to $433,780,463.96908, indicating a substantial level of market activity.
2024年9月17日午後8時(協定世界時)の時点で、ドージコイン(DOGE)の最新価格は0.10075167170007ドルでした。 24時間の取引高は4億3378万4639万6908ドルに達し、相当なレベルの市場活動を示した。
However, the price of DOGE has experienced a decline of -0.94729493% over the past 24 hours. This downward trend has somewhat diminished the value of Dogecoin in the short term.
ただし、DOGEの価格は過去24時間で-0.94729493%下落しました。この下降傾向により、短期的にはドージコインの価値がいくらか減少しました。
Key Supply and Market Cap Figures
主要な供給量と時価総額の数値
- Circulating supply: 145,993,126,383.71 DOGE
- Maximum supply: N/A
- Total supply: 145,993,126,383.71 DOGE
The market capitalization of Dogecoin currently stands at $14,709,051,539.878, reflecting the total value of all DOGE coins in circulation. The fluctuation in price has had a corresponding impact on Dogecoin's market cap, which has also experienced some volatility.
流通供給量: 145,993,126,383.71 DOGE最大供給量: N/A総供給量: 145,993,126,383.71 DOGEDogecoin の時価総額は現在 14,709,051,539.878 ドルで、流通しているすべての DOGE コインの合計価値を反映しています。価格の変動はドージコインの時価総額にも同様の影響を与え、ある程度の変動も経験しました。
Technical Outlook
技術的な見通し
The technical analysis of Dogecoin's price chart suggests a period of consolidation and potentially bearish momentum in the near term. The 50-day moving average (MA) is currently above the 200-day MA, indicating a bullish bias in the long term. However, the recent price decline has pushed DOGE below the 50-day MA, suggesting a possible reversal of trend.
ドージコインの価格チャートのテクニカル分析は、短期的には統合の期間と弱気の勢いが続く可能性を示唆しています。 50日移動平均(MA)は現在200日移動平均を上回っており、長期的には強気のバイアスがかかっていることを示しています。しかし、最近の価格下落によりDOGEは50日間移動平均線を下回っており、トレンドが反転する可能性を示唆している。
Traders and investors may monitor the support and resistance levels closely to determine the potential direction of Dogecoin's price. Support levels could provide a cushion against further decline, while resistance levels could indicate potential barriers to upward movement.
トレーダーと投資家は、ドージコインの価格の潜在的な方向性を判断するために、サポートレベルとレジスタンスレベルを注意深く監視する可能性があります。サポートレベルはさらなる下落に対するクッションとなる可能性がある一方、レジスタンスレベルは上昇への潜在的な障壁を示す可能性があります。


 crypto.ro English
 DogeHome
 Crypto News Land
 ETHNews
 CFN
CFN U_Today
 Thecoinrepublic.com
 Optimisus


