Solana Price Surges 8% to Hit New Heights
ソラナ価格が8%急騰し新たな高みに到達
As of 11:40 a.m. EST, the Solana price has experienced a remarkable 8% surge, propelling it to $240.47. Notably, trading volume has spiked by 53% to reach an impressive $10.9 billion.
東部標準時間午前11時40分の時点で、ソラナの価格は8%という驚くべき急騰を経験し、240.47ドルまで上昇しました。特に、取引高は53%急増し、109億ドルという驚異的な額に達しました。
This surge comes on the heels of Solana's recent milestone, reaching a new all-time high (ATH) of $264.31 on Coinbase. The asset's upward trajectory has been fueled by a series of filings this week from investment firms including Bitwise, VanEck, 21Shares, and Canary Capital, signaling their intention to launch spot Solana ETFs (exchange-traded funds).
この急騰は、Coinbaseで264.31ドルの新たな史上最高値(ATH)に達したSolanaの最近のマイルストーンに続いて起こりました。今週、ビットワイズ、ヴァンエック、21シェアーズ、カナリー・キャピタルなどの投資会社がスポットソラナETF(上場投資信託)を立ち上げる意向を示す一連の申請書を提出したことで、この資産の上昇軌道が加速した。
Meme Coin Mania Boosts Solana's Popularity
ミームコインマニアがソラナの人気を高める
Another contributing factor to Solana's popularity has been the recent outbreak of meme coin mania. Notably, the launch of Pump.fun, a meme coin launching platform, has generated anticipation and the promise of revenue growth.
Solana の人気のもう 1 つの要因は、最近のミームコインマニアの発生です。特に、ミームコイン立ち上げプラットフォームであるPump.funの立ち上げは、期待と収益増加の期待を生み出しました。
Solana's Uptrend and Technical Indicators
ソラナの上昇トレンドとテクニカル指標
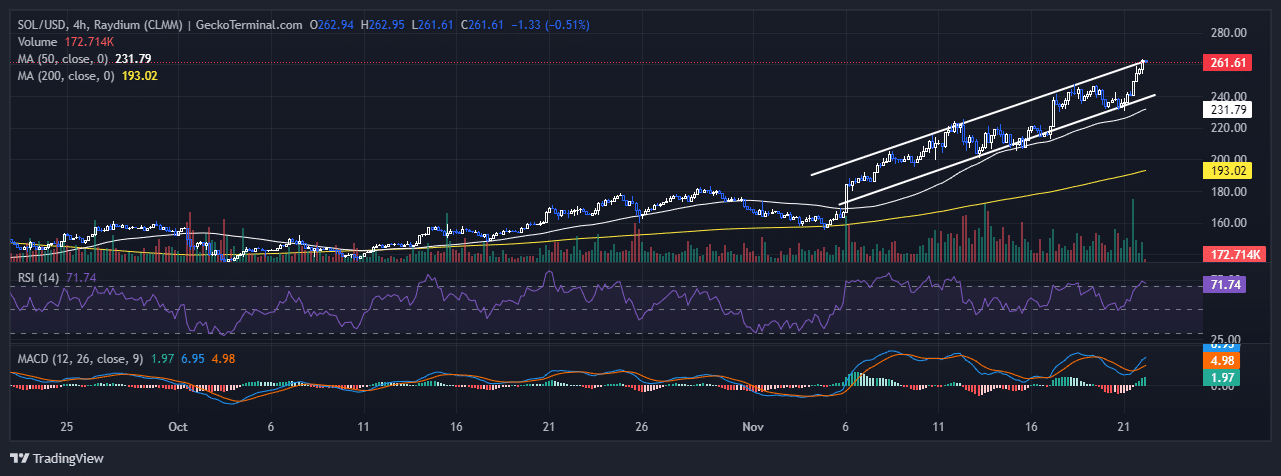
Since October, the Solana price has maintained an uptrend, with bulls solidifying their dominance around the $160 support zone. The asset's momentum gained further traction in November, leading to a series of higher highs and higher lows, forming a rising channel pattern.
10月以来、ソラナ価格は上昇傾向を維持しており、強気派は160ドルのサポートゾーン付近で優位性を固めている。この資産の勢いは11月にさらに勢いを増し、一連の高値と安値の上昇につながり、上昇チャネルパターンを形成しました。
Amidst this uptrend, Solana has consistently stayed above both its 50-day and 200-day Simple Moving Averages (SMAs).
この上昇傾向の中で、ソラナは一貫して 50 日および 200 日の単純移動平均 (SMA) を上回っています。
Overbought RSI and Bullish MACD
買われ過ぎのRSIと強気のMACD
Currently, the Relative Strength Index (RSI) stands at 71, indicating that the asset may be overextended in the short term. However, it's worth noting that overbought RSI levels can often lead to pullbacks or consolidation. Nonetheless, in strong bullish trends, RSI can remain overbought for extended periods.
現在、相対強度指数 (RSI) は 71 であり、資産が短期的には過度に拡張される可能性があることを示しています。ただし、買われすぎたRSIレベルはしばしば反発や保ち合いにつながる可能性があることに注意する必要があります。それにもかかわらず、強い強気トレンドでは、RSIは長期間にわたって買われすぎになる可能性があります。
The Moving Average Convergence Divergence (MACD) line (1.97) remains above the signal line (0.98) and in positive territory, suggesting ongoing bullish momentum. The histogram is green and increasing, further confirming the strengthening of bullish sentiment. However, the MACD is not excessively high, indicating that there may still be room for further upward movement before a potential reversal.
移動平均収束ダイバージェンス (MACD) ライン (1.97) は引き続きシグナルライン (0.98) を上回り、プラス領域にあり、強気の勢いが続いていることを示唆しています。ヒストグラムは緑色で増加しており、強気感情の強さをさらに裏付けています。ただし、MACD は過度に高いわけではなく、潜在的な反転の前にさらに上昇する余地がまだある可能性があることを示しています。
Potential Price Targets
潜在的な価格目標
If the current upward trajectory continues, bulls could propel the price of Solana towards a new all-time high (ATH), aiming for $300.
現在の上昇軌道が続けば、強気派はソラナ価格を史上最高値(ATH)に向けて押し上げ、300ドルを目指す可能性がある。
Potential Correction Zone
潜在的な修正ゾーン
However, given the current overbought RSI, the Solana price may experience a correction to the $231 support zone (50-day SMA).
ただし、現在のRSIが買われすぎていることを考えると、ソラナ価格は231ドルのサポートゾーン(50日SMA)まで修正される可能性があります。

Disclaimer
免責事項
This information solely serves as a general market commentary and does not constitute financial advice. Always conduct thorough research before making any investment decisions.
この情報は一般的な市場の解説としてのみ機能し、財務上のアドバイスを構成するものではありません。投資を決定する前に、必ず徹底的なリサーチを行ってください。


 Crypto Daily™
 BlockchainReporter
 TheCoinrise Media
 DogeHome
 Crypto Daily™
 Crypto Daily™
 TheCoinrise Media
 Thecoinrepublic.com


