With Bitcoin reaching over $71,000 and the crypto market approaching $2.5 trillion, the surge in meme coins continues its momentum. Dogecoin remains at the forefront with a 14% increase in the past day, pushing the combined market cap of meme coins to $62.23 billion, with a $9.74 billion trading volume.
ビットコインが71,000ドル以上に達し、仮想通貨市場が2兆5000億ドルに近づく中、ミームコインの急増はその勢いを続けています。ドージコインは過去1日で14%上昇し、引き続き最前線に立っており、ミームコインの時価総額は合計622億3000万ドル、取引高は97億4000万ドルに達した。
Given the 125% surge in the leading meme coin, the others are poised for substantial returns. Here are some top meme coin choices for potential growth in November:
主要なミームコインが125%上昇したことを考えると、他のミームコインもかなりの利益を得る準備ができています。 11月に潜在的な成長が期待できるミームコインのトップの選択肢は次のとおりです。
Top Meme Coin Picks:
ミームコインのトップピック:
Dogecoin (DOGE)
ドージコイン (DOGE)
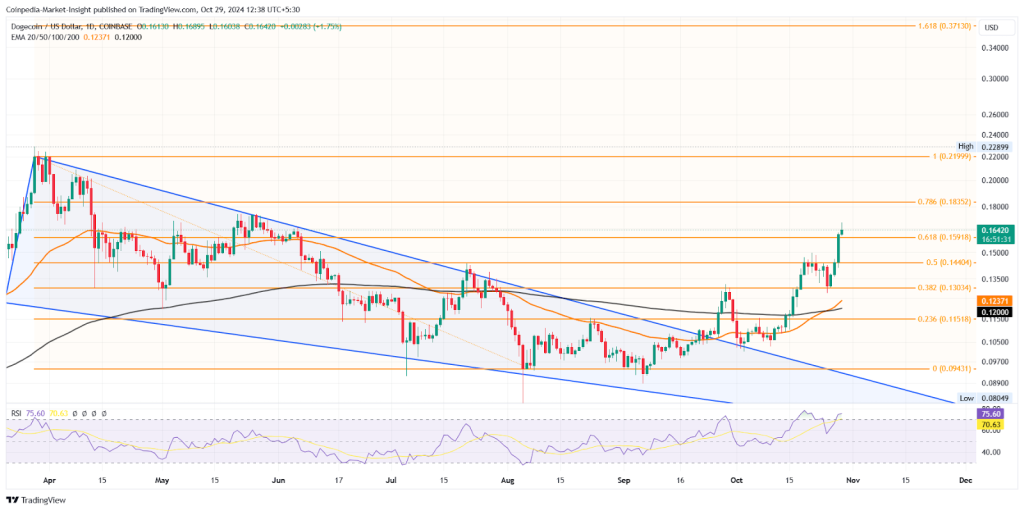
Dogecoin's market cap has reached $24 billion, with its price rising 16.16% in the past 24 hours. Currently trading at $0.168, Dogecoin continues to lead the meme coin rally.
ドージコインの時価総額は240億ドルに達し、価格は過去24時間で16.16%上昇した。現在0.168ドルで取引されているドージコインは、ミームコインラリーをリードし続けています。

Tradingview
トレーディングビュー
Dogecoin has surged significantly, surpassing the $0.15 level and the 61.80% Fibonacci level. The uptrend is approaching the 78.60% level at $0.1835 and the all-time high of $0.2289.
ドージコインは大幅に上昇し、0.15ドルのレベルと61.80%のフィボナッチレベルを超えました。上昇トレンドは78.60%水準の0.1835ドルと過去最高値の0.2289ドルに近づいている。
The golden crossover between the 50-day and 200-day EMAs supports the bullish momentum. If Dogecoin maintains its upward trajectory, it is likely to reach $0.3713 by the end of November.
50日EMAと200日EMAの間のゴールデンクロスオーバーが強気の勢いを支えています。ドージコインが上昇軌道を維持すれば、11月末までに0.3713ドルに達する可能性がある。
Will DOGE's wedge breakout lead to a new all-time high? Discover more in Coinpedia's DOGE price prediction.
DOGEのウェッジブレイクは史上最高値更新につながるでしょうか? Coinpedia の DOGE 価格予測で詳細をご覧ください。
Dogwifhat (WIF)
ドッグウィファット (WIF)
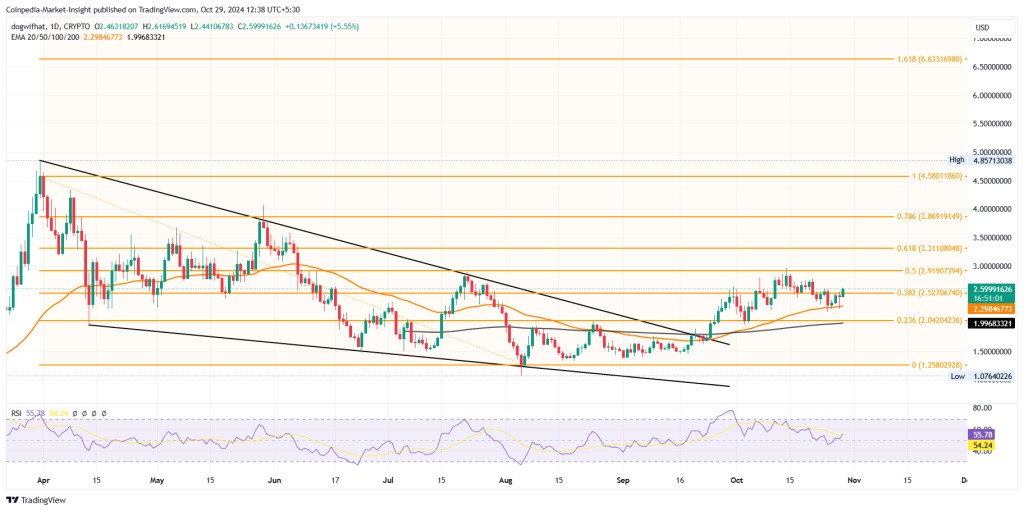
With a market cap of $2.62 billion, WIF has risen 8.56% in the past 24 hours. Currently trading at $2.62, WIF is experiencing a bullish reversal from the 50-day EMA.
時価総額は26億2000万ドルで、WIFは過去24時間で8.56%上昇した。現在2.62ドルで取引されているWIFは、50日間EMAからの強気の反転を経験しています。

TradingView
TradingView
Surpassing the 38.20% Fibonacci level at $2.52, WIF is expected to face resistance at the 50% level of $2.99. As the market recovers and the RSI line recovers from its midline, WIF is likely to continue its breakout rally next week.
WIFは2.52ドルの38.20%フィボナッチレベルを超え、50%レベルの2.99ドルで抵抗に直面すると予想される。市場が回復し、RSIラインが正中線から回復するにつれ、WIFは来週もブレイクアウトラリーを続ける可能性が高い。
The uptrend could reach the 78.60% Fibonacci level of $2.89. Driven by the market recovery, WIF has the potential to reach $4.50 and $6.60 based on the Fibonacci levels.
上昇トレンドは78.60%フィボナッチレベルの2.89ドルに達する可能性がある。市場の回復に牽引され、WIFはフィボナッチレベルに基づいて4.50ドルと6.60ドルに達する可能性があります。
MOG Coin (MOG)
モグコイン(MOG)
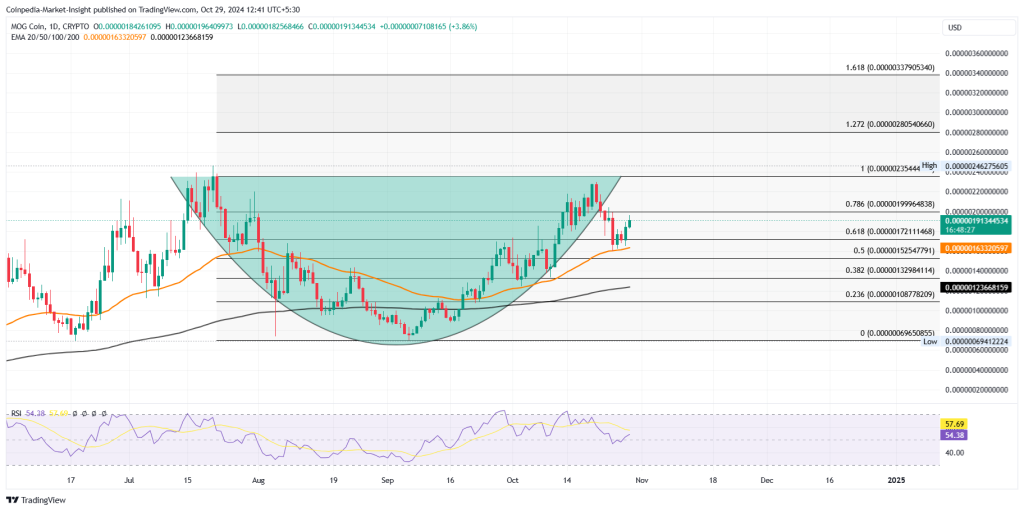
MOG's market cap currently stands at $746 million, having increased by 10.37% in the past 24 hours. It is trading at $0.000001912. With a bullish reversal from the 50-day EMA, MOG's uptrend is testing the 78.60% Fibonacci level at $0.0000020.
MOGの時価総額は現在7億4,600万ドルで、過去24時間で10.37%増加した。 0.000001912ドルで取引されています。 50日間EMAからの強気の反転により、MOGの上昇トレンドは0.0000020ドルの78.60%フィボナッチレベルを試しています。

TradingView
TradingView
MOG has formed a cup and handle pattern, with the neckline near $0.000003544. Using Fibonacci retracement, the price target for the breakout rally is $0.0000028 and $0.0000038.
MOG はカップとハンドルのパターンを形成し、ネックラインは $0.000003544 付近です。フィボナッチリトレースメントを使用すると、ブレイクアウトラリーの目標価格は 0.0000028 ドルと 0.0000038 ドルになります。
Cat in a Dogs World (MEW)
犬の世界の猫 (MEW)
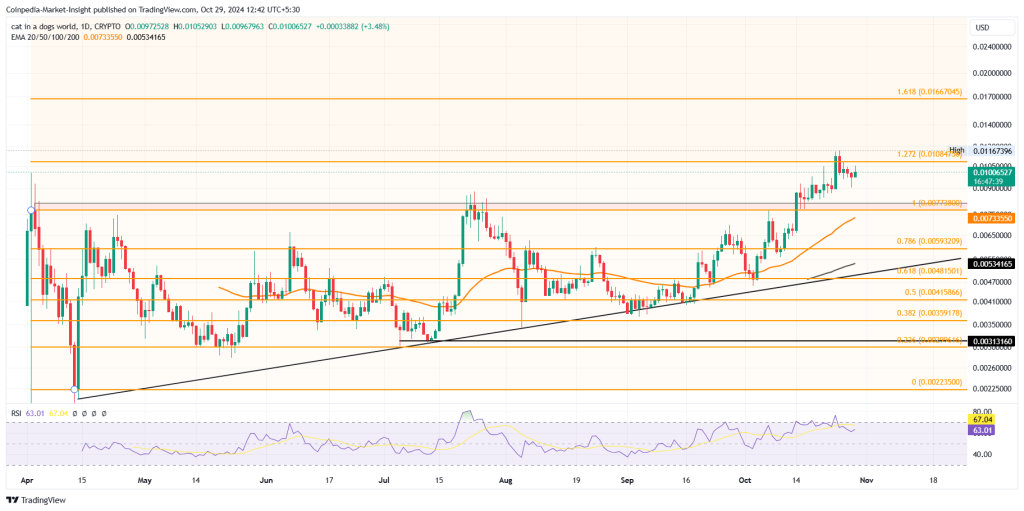
MEW's market cap has reached $896 million, with a 6.2% increase in the past 24 hours. The CAT-themed meme coin is trading at $0.01009.
MEWの時価総額は8億9600万ドルに達し、過去24時間で6.2%上昇した。 CATをテーマにしたミームコインは0.01009ドルで取引されている。

Tradingview
トレーディングビュー
The daily chart shows MEW's ascending triangle breakout rally facing resistance near the 1.272 Fibonacci level at $0.01084. With an intraday gain of 3.48%, MEW has the potential to reach the next target at the 1.618 Fibonacci level of $0.01667.
日足チャートは、MEWの上昇トライアングルブレイクアウトラリーが1.272フィボナッチレベル付近の0.01084ドルの抵抗に直面していることを示しています。日中の上昇率は3.48%で、MEWは次のターゲットである1.618フィボナッチレベルの0.01667ドルに到達する可能性があります。
However, the slight bearish divergence in the RSI line suggests a possible minor pullback before the uptrend continues.
ただし、RSI ラインのわずかな弱気の発散は、上昇トレンドが続く前に小さな反落の可能性を示唆しています。


 Cryptopolitan
 DogeHome
 crypto.ro English
 Crypto News Land
 ETHNews
 CFN
CFN U_Today
 Thecoinrepublic.com


