Headline: Market Update: XRP Nearing Resistance, Ethereum's Bullish Ascent, Dogecoin's Bullish Continuation
見出し: 市場最新情報: レジスタンスに近づくXRP、イーサリアムの強気上昇、ドージコインの強気継続
XRP's Price Surge and Potential Reversal
XRPの価格高騰と反転の可能性
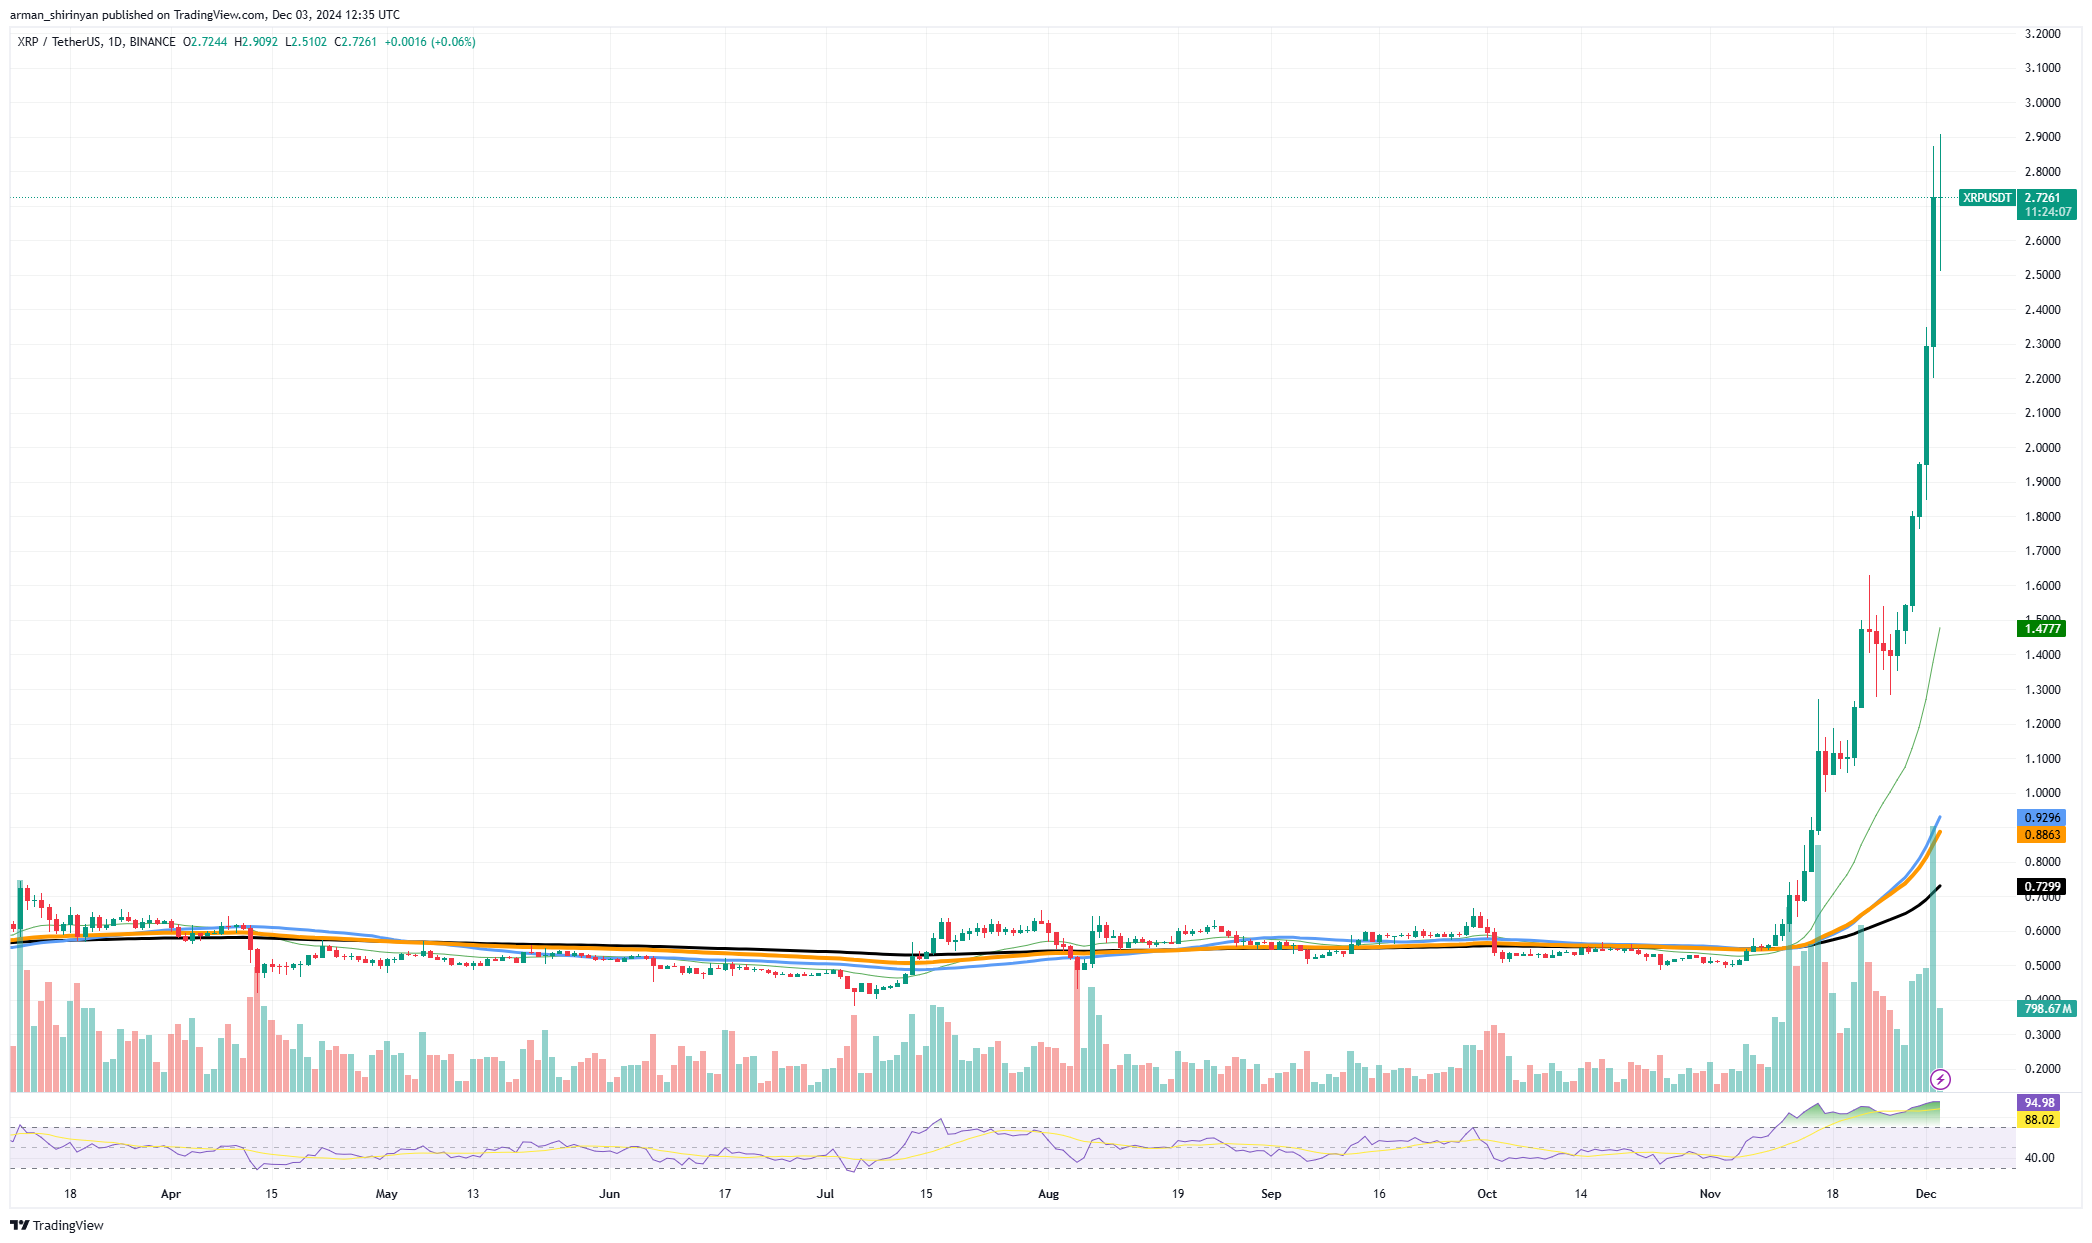
XRP's recent rally has pushed its price to levels not seen in years. However, a potential reversal candle on the daily chart suggests that the trend may be slowing. As sellers regain control and buyers lose momentum, these formations often signal a shift from bullish to bearish sentiment.
XRPの最近の上昇により、価格はここ数年で見られないレベルにまで上昇しました。ただし、日足チャートの反転ローソク足の可能性は、トレンドが減速している可能性を示唆しています。売り手がコントロールを取り戻し、買い手が勢いを失うと、これらのフォーメーションは多くの場合、強気から弱気へのセンチメントの変化を示します。
At $2.76, XRP's price shows signs of hesitation near the psychological resistance level of $3. This price point has historically acted as a barrier, where traders tend to lock in profits. The reversal candle, with a long wick above the body, indicates strong selling pressure at these elevated levels.
XRPの価格は2.76ドルで、心理的抵抗レベルである3ドル付近でためらいの兆しが見られる。この価格帯は歴史的に障壁として機能しており、トレーダーは利益を確定させる傾向があります。反転ローソク足は実体の上に長い芯を持ち、このような上昇したレベルでの強い売り圧力を示しています。
Despite the potential reversal, XRP's breakout above key moving averages, including the 50-day and 200-day exponential moving averages, suggests that the overall uptrend remains intact for now.  XRP/USDT Chart by TradingView">
逆転の可能性にもかかわらず、XRPが50日および200日の指数移動平均を含む主要な移動平均を上回ったことは、全体的な上昇傾向が今のところそのままであることを示唆しています。
However, RSI readings above 88 indicate that the asset is significantly overbought, raising concerns about a potential short-term decline. In the event of a reversal, the previous breakout zone around $2.40 provides immediate support. For a more severe correction, the price could move towards the 21-day EMA, a frequently observed level in bullish trends at $2.00.
しかし、RSI値が88を超えていることは、この資産が著しく買われすぎていることを示しており、短期的な下落の可能性に対する懸念が高まっている。反転の場合、2.40ドル付近の前のブレイクアウトゾーンが即座のサポートとなります。より深刻な調整の場合、価格は強気トレンドで頻繁に観察されるレベルである2.00ドルの21日間EMAに向けて動く可能性があります。
Conversely, if XRP invalidates the reversal signal and breaks above $3 with significant volume, it could potentially rally higher towards $3.50 or even further. This would require increased market participation and fresh buying momentum.
逆に、XRPが反転シグナルを無効にし、かなりの出来高で3ドルを超えた場合、3.50ドル、あるいはそれ以上に向けて上昇する可能性があります。そのためには、市場参加者の増加と新たな購入の勢いが必要となります。
Ethereum's Bullish Ascent
イーサリアムの強気上昇
Ethereum, the second-largest cryptocurrency, may be gearing up for a surge towards the crucial $4,000 mark, based on its recent price action. Ethereum currently trades near $3,610 after undergoing a significant uptrend supported by several bullish indicators evident on the chart.
2番目に大きい仮想通貨であるイーサリアムは、最近の価格動向に基づくと、重要な4,000ドルのマークに向けて急騰に備えている可能性がある。イーサリアムは、チャートで明らかないくつかの強気指標に支えられ大幅な上昇傾向を経て、現在3,610ドル付近で取引されています。
One of Ethereum's strongest points is its recovery above critical moving averages. A golden cross, a well-known bullish pattern, has been signaled with the 50-day EMA crossing above the 200-day EMA. This formation often attracts further buying momentum as traders anticipate continued upward movement. Ethereum remains above its 21-day EMA, which has acted as a dynamic support level throughout this rally.
イーサリアムの最も強い点の1つは、重要な移動平均を上回る回復です。よく知られている強気パターンであるゴールデンクロスは、50日EMAが200日EMAを上回ったことで示されています。トレーダーが継続的な上昇相場を予想しているため、このフォーメーションはさらなる買いの勢いを引き付けることがよくあります。イーサリアムは、この上昇を通じてダイナミックなサポートレベルとして機能してきた21日間EMAを上回ったままです。
Volume levels also exhibit encouraging trends, with recent trading activity consistently higher than during bearish months earlier this year. This indicates growing investor confidence and interest, which are essential for Ethereum to challenge $4,000.
出来高レベルも心強い傾向を示しており、最近の取引活動は今年初めの弱気な月よりも一貫して高くなっています。これは、イーサリアムが4,000ドルに挑戦するために不可欠である投資家の信頼と関心が高まっていることを示しています。
Ethereum is not without its challenges, however. RSI levels are approaching the overbought territory at 65, which could lead to a brief decline or consolidation. The resistance level around $3,700 could act as a barrier before Ethereum attempts to break higher again.
ただし、イーサリアムにも課題がないわけではありません。 RSIレベルは65の買われ過ぎ領域に近づいており、一時的な下落または値固めにつながる可能性がある。 3,700ドル付近の抵抗レベルは、イーサリアムが再び高値を突破しようとする前に障壁として機能する可能性があります。
Overall, the market outlook for Ethereum remains positive, especially considering the growing adoption of layer-2 scaling solutions and the ongoing expansion of DeFi applications. If momentum holds, Ethereum could revisit lower support levels at $3,300 or even $3,000. Consistent volume and bullish sentiment will be key for Ethereum to reach $4,000. A strong breakout above $3,700, coupled with increased buying interest, would pave the way for a higher move. Conversely, any signs of dwindling momentum could lead to a halt or even a reversal.
全体として、特にレイヤー2スケーリングソリューションの採用の増加とDeFiアプリケーションの継続的な拡大を考慮すると、イーサリアムの市場見通しは引き続き明るいです。勢いが維持できれば、イーサリアムは3,300ドル、さらには3,000ドルという低いサポートレベルに再訪する可能性がある。イーサリアムが4,000ドルに到達するには、安定した出来高と強気なセンチメントが鍵となるだろう。 3,700ドルを大きく突破できれば、買い意欲の高まりと相まって、さらなる上昇への道が開かれるだろう。逆に、勢いが衰える兆候があれば、停止や反転につながる可能性があります。
Dogecoin's Bullish Flag
ドージコインの強気フラグ
Dogecoin exhibits an ascending flag pattern on its daily chart, a classic bullish continuation configuration. After its impressive rally in November, the price has entered a consolidation phase characterized by a narrowing channel and higher lows and highs. Dogecoin currently trades around $0.418, holding above important moving averages such as the 21-day EMA, which provides immediate support at $0.38.
ドージコインは日足チャートで上昇フラグパターンを示しており、典型的な強気継続構成となっています。 11月の目覚ましい上昇の後、価格はチャネルの縮小と安値と高値の上昇を特徴とする保ち合い段階に入った。ドージコインは現在0.418ドル付近で取引されており、0.38ドルが当面のサポートとなる21日間EMAなどの重要な移動平均を上回っている。
The flag pattern structure relies on this dynamic support. A breakout above the flag's upper trend line, currently around $0.44, could signal an extension of the previous bullish trend. As is typical during flag formations, volume has somewhat tapered off during this consolidation period.
フラグ パターン構造は、この動的サポートに依存しています。現在約0.44ドルである旗の上部トレンドラインを上抜ければ、以前の強気トレンドの延長を示す可能性があります。フラッグ形成時にはよくあることですが、この統合期間中は出来高が若干減少します。
A breakout validation would require a surge in buying volume, with an initial target of $0.50. If momentum sustains, DOGE could attempt to attack the psychological level of $0.60, which coincides with its previous resistance zones.
ブレイクアウトの検証には、当初の目標を0.50ドルとして、購入量を急増させる必要がある。この勢いが持続すれば、DOGEは以前のレジスタンスゾーンと一致する0.60ドルの心理的水準を攻撃しようとする可能性がある。
However, caution is warranted. A failure to hold above the 21-day EMA could lead DOGE closer to the $0.36 support level. If this zone is breached, the 50-day EMA currently sits in the $0.30 region, which could be retested, invalidating the flag pattern.
ただし、注意が必要です。 21日間EMAを上回れなければ、DOGEは0.36ドルのサポートレベルに近づく可能性がある。このゾーンを突破した場合、50日間EMAは現在0.30ドルの領域にあり、再テストされる可能性があり、フラグパターンが無効になります。
Short-term pullbacks are possible, as suggested by the RSI hovering around 71, just outside the overbought zone. DOGE remains a speculative asset that tends to gain traction during spikes in retail interest, but the overall market sentiment remains positive.
RSIが買われ過ぎゾーンのすぐ外側、71付近で推移していることからわかるように、短期的な反発の可能性がある。 DOGE は依然として投機的資産であり、小売への関心が急上昇する際に勢いを増す傾向がありますが、市場全体のセンチメントは引き続きポジティブです。


 Cointelegraph
 Cryptopolitan_News
 Optimisus
 Thecoinrepublic.com
 Cryptopolitan_News
 CaptainAltcoin
 DogeHome
 crypto.news


