Dogecoin Price Crash Warning: Technical Analysis Points to Bearish Trend
Dogecoin 가격 충돌 경고: 기술적 분석은 약세 추세를 나타냅니다.
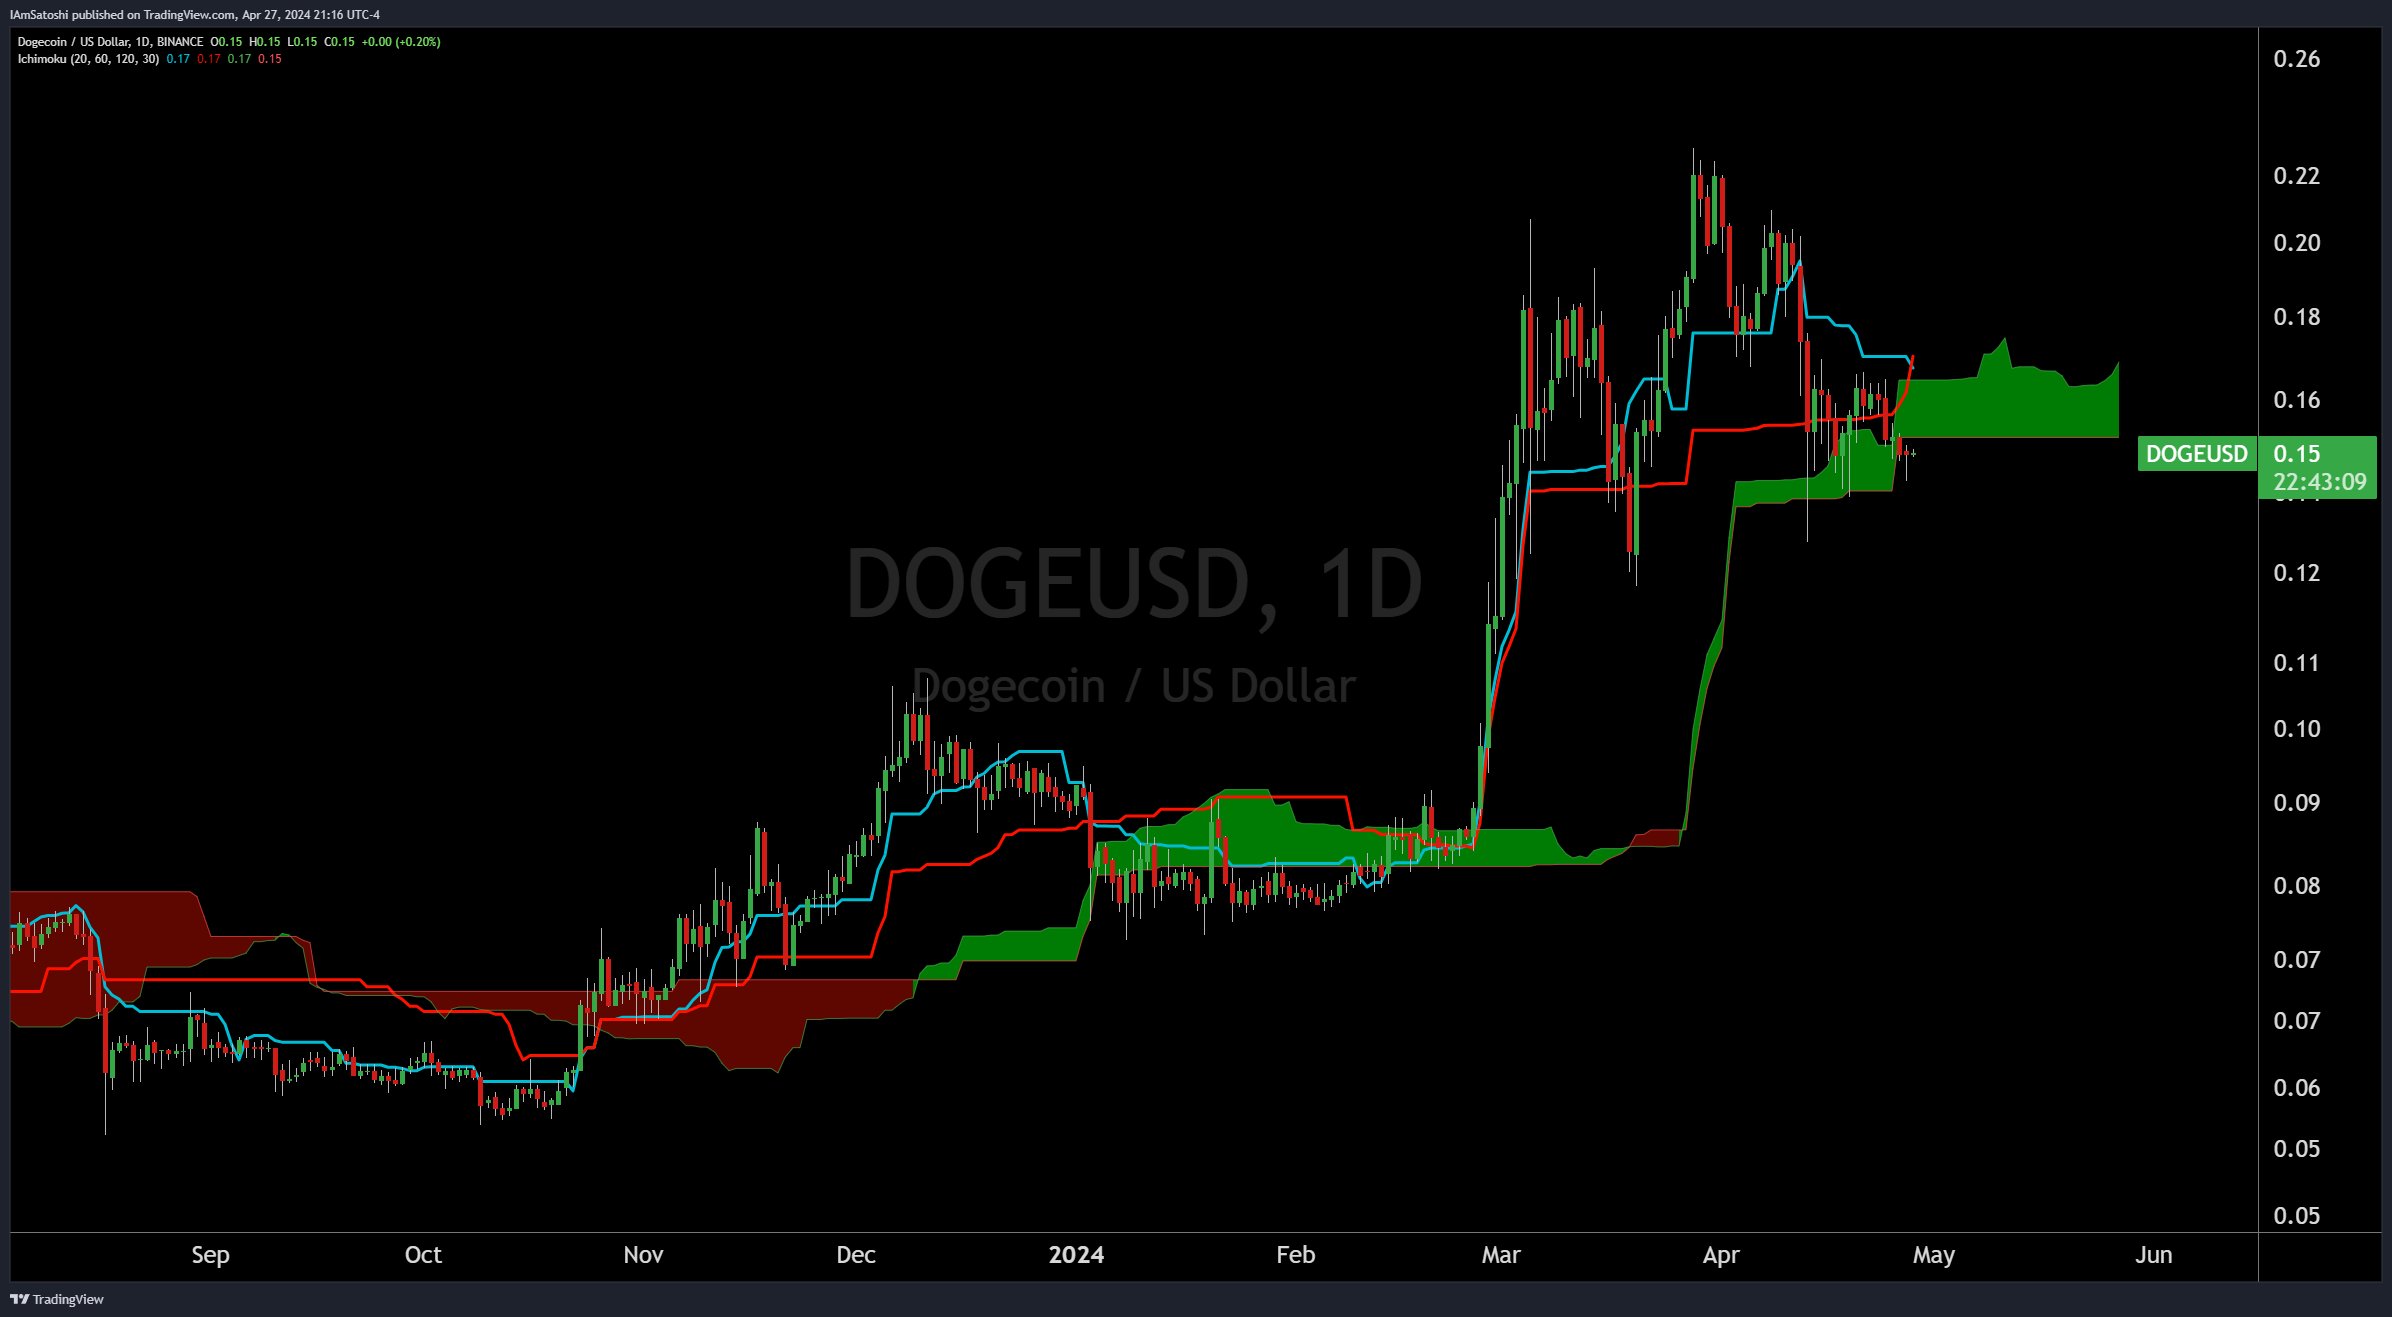
Crypto analyst Josh Olszewicz issues a warning of an impending Dogecoin price crash. His analysis relies on the Ichimoku Cloud indicator, which provides insights into support/resistance levels, momentum, and trend direction.
암호화폐 분석가인 Josh Olszewicz는 도지코인 가격 붕괴가 임박할 것이라고 경고했습니다. 그의 분석은 지지/저항 수준, 모멘텀 및 추세 방향에 대한 통찰력을 제공하는 Ichimoku Cloud 지표를 사용합니다.
Bearish Signals for Dogecoin
Dogecoin의 약세 신호
Olszewicz identifies two specific technical phenomena on the 1-day (1D) chart of DOGE against the US dollar (DOGE/USD):
Olszewicz는 미국 달러(DOGE/USD)에 대한 DOGE의 1일(1D) 차트에서 두 가지 구체적인 기술적 현상을 식별합니다.
1. Bearish TK Cross: The bearish crossover between the Tenkan-Sen (conversion line) and the Kijun-Sen (baseline) within the Ichimoku Cloud system indicates that short-term prices are falling below the base level of prices over the past month, suggesting further downward movement. 
1. 약세 TK 크로스: Ichimoku Cloud 시스템 내 Tenkan-Sen(변환선)과 Kijun-Sen(기준선) 간의 약세 크로스오버는 단기 가격이 지난 한 달 동안 기준 가격 수준 아래로 하락하고 있음을 나타냅니다. 추가적인 하향 움직임을 시사합니다.
2. Bearish Kumo Breakout: The 'Kumo' (cloud) represents a key area on the chart that can act as support or resistance. A 'bearish Kumo breakout' implies that the price has broken through the cloud downwards, confirming a bearish trend. The price below the Kumo indicates negative market sentiment, with the Kumo now likely acting as resistance to upward price movement. 
2. Kumo 약세 돌파: 'Kumo'(구름)는 차트에서 지지 또는 저항 역할을 할 수 있는 핵심 영역을 나타냅니다. '약세 구모 돌파'는 가격이 하향 구름을 뚫고 약세 추세를 확인했음을 의미합니다. Kumo보다 낮은 가격은 부정적인 시장 심리를 나타내며, Kumo는 이제 가격 상승 움직임에 대한 저항으로 작용할 가능성이 높습니다.
40% Price Crash Looming?
40% 가격 폭락이 다가오고 있나요?
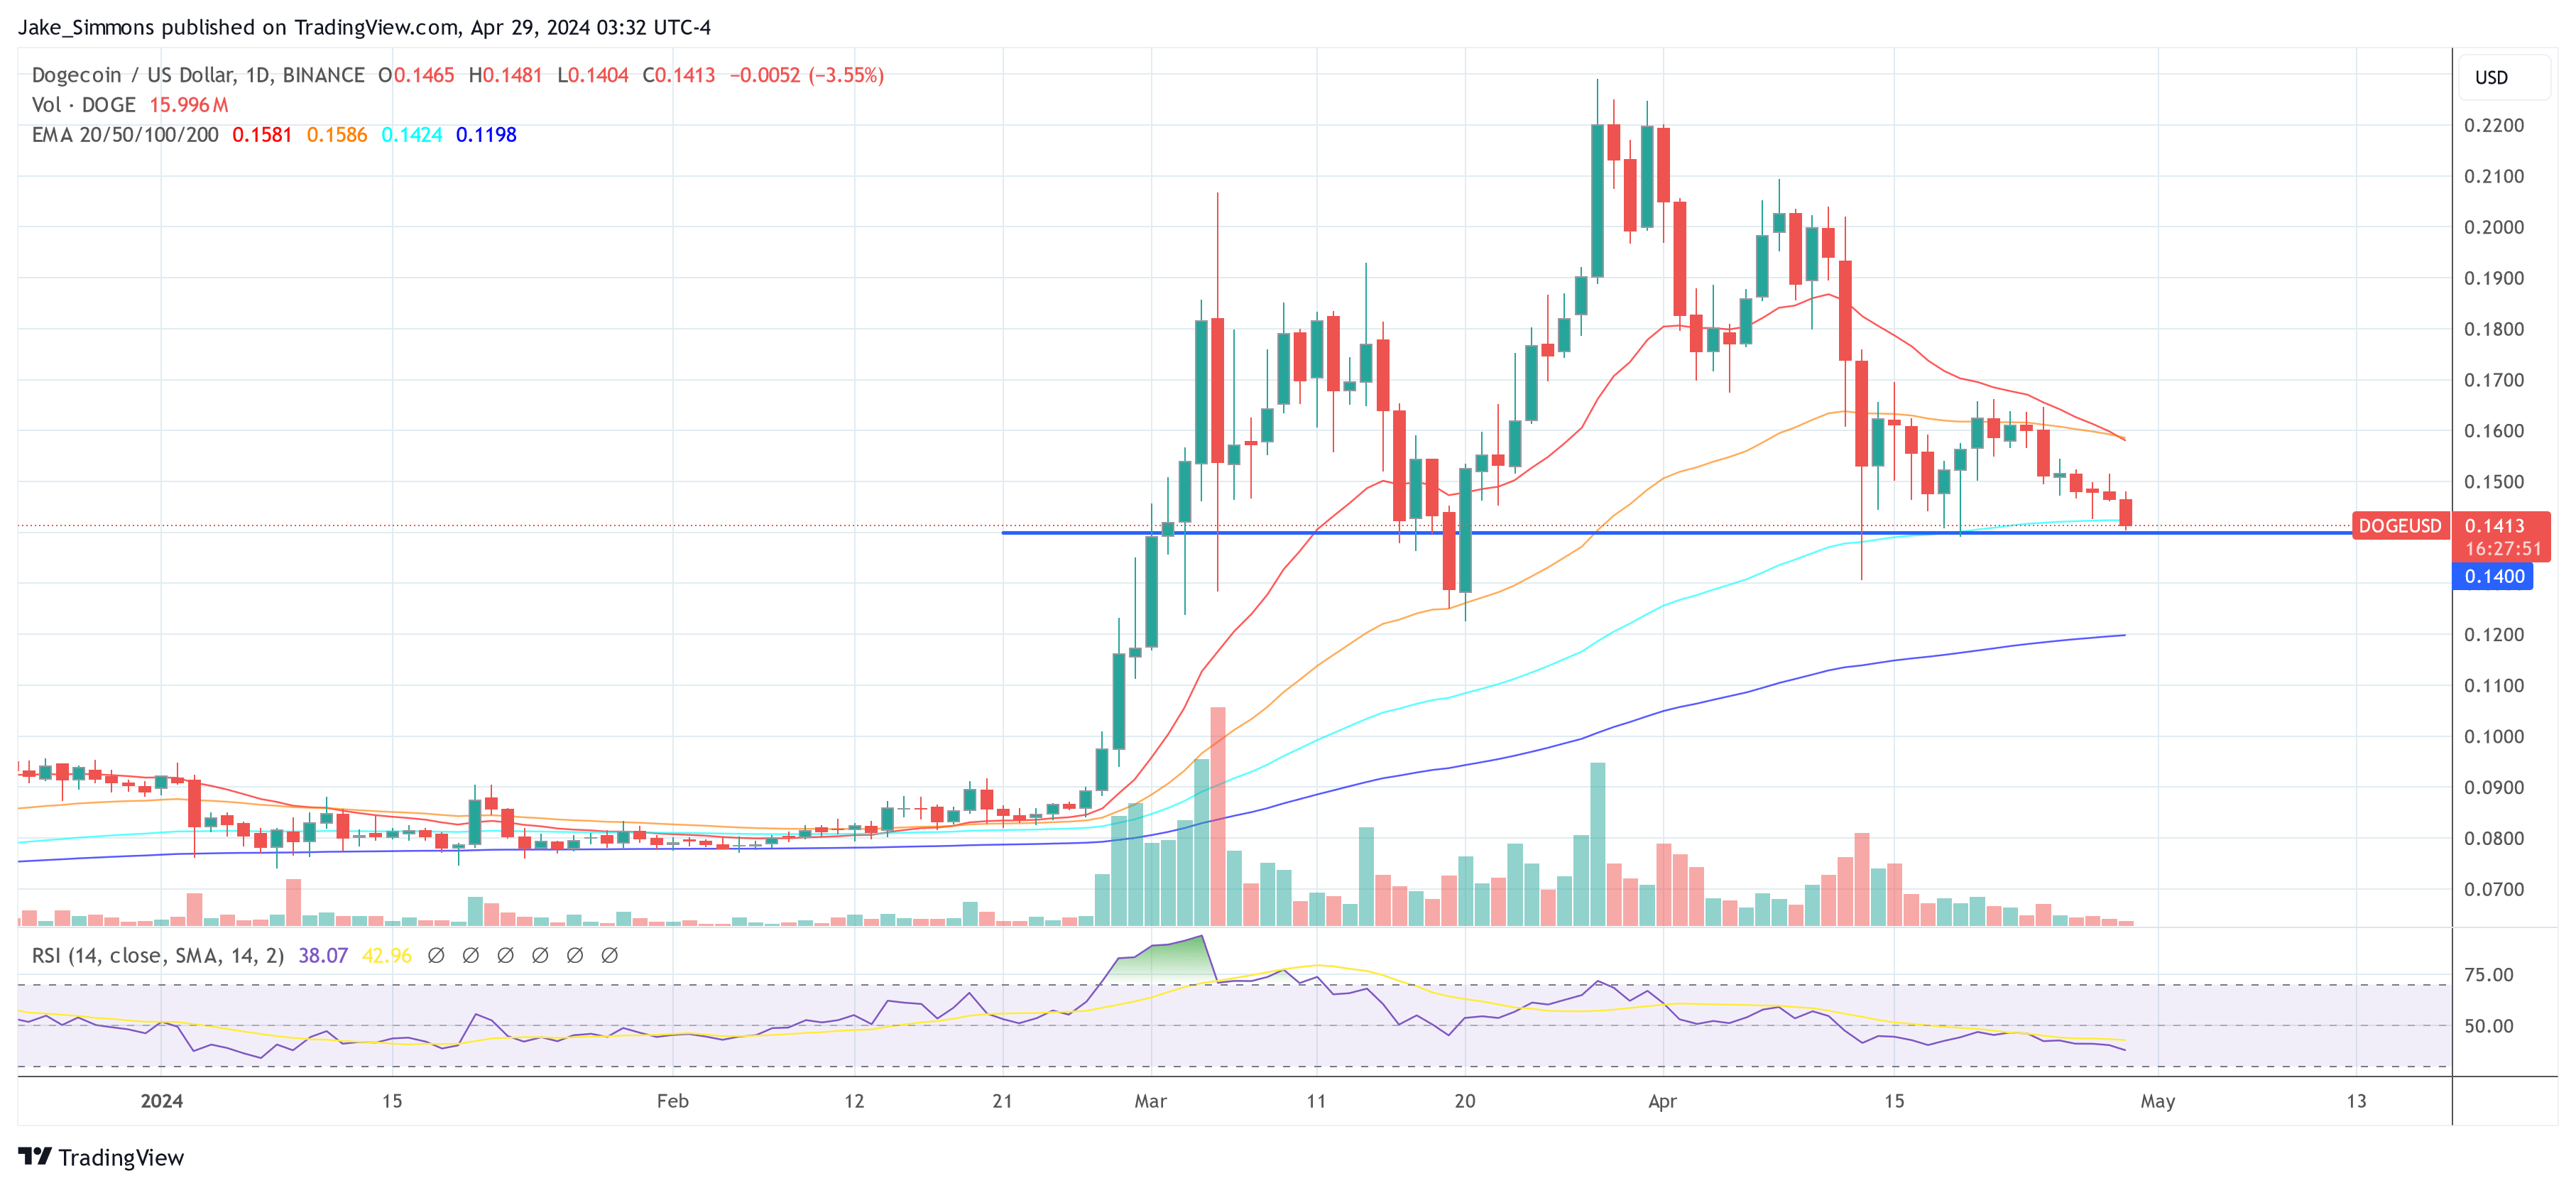
These technical signals reinforce Olszewicz's previous DOGE price analysis, which identified a potential Head and Shoulders (H&S) formation on the 12-hour chart. If Dogecoin's price breaks below $0.14, the H&S pattern could be validated, leading to a potential sell-off towards $0.10 to $0.09. This target area aligns with Fibonacci extension levels, suggesting a price crash of around 40%.
이러한 기술적 신호는 12시간 차트에서 잠재적인 헤드 앤 숄더(H&S) 형성을 식별한 Olszewicz의 이전 DOGE 가격 분석을 강화합니다. Dogecoin의 가격이 $0.14 아래로 떨어지면 H&S 패턴이 검증될 수 있으며 $0.10에서 $0.09까지 매도할 가능성이 있습니다. 이 목표 영역은 피보나치 확장 수준과 일치하며 약 40%의 가격 폭락을 암시합니다.
Cautionary Signal
주의 신호
While the H&S pattern has not yet been confirmed, the presence of the bearish TK cross and Kumo breakout serves as a cautionary signal for the market. Market participants should closely monitor the $0.14 level, as a break below could trigger the anticipated decline.
H&S 패턴은 아직 확인되지 않았지만 약세 TK 크로스와 Kumo 이탈이 시장에 경고 신호로 작용하고 있습니다. 시장 참가자들은 $0.14 수준을 면밀히 모니터링해야 합니다. 그 이유는 $0.14 수준을 밑돌면 예상되는 하락세를 촉발할 수 있기 때문입니다.
At press time, DOGE traded at $0.1413.
보도 당시 DOGE는 $0.1413에 거래되었습니다.
Disclaimer: This article is for educational purposes only and does not constitute financial advice. Investing carries risks, and you should always conduct your own research before making any investment decisions.
면책 조항: 이 기사는 교육 목적으로만 작성되었으며 재정적 조언을 구성하지 않습니다. 투자에는 위험이 수반되므로 투자 결정을 내리기 전에 항상 스스로 조사를 수행해야 합니다.


 BlockchainReporter
 CoinPedia News
 TheNewsCrypto
 CFN
CFN DogeHome
 Optimisus
 Crypto News Land
 Optimisus


