Dogecoin Price Crash Warning: Technical Analysis Points to Bearish Trend
ドージコイン価格暴落の警告:テクニカル分析は弱気傾向を示している
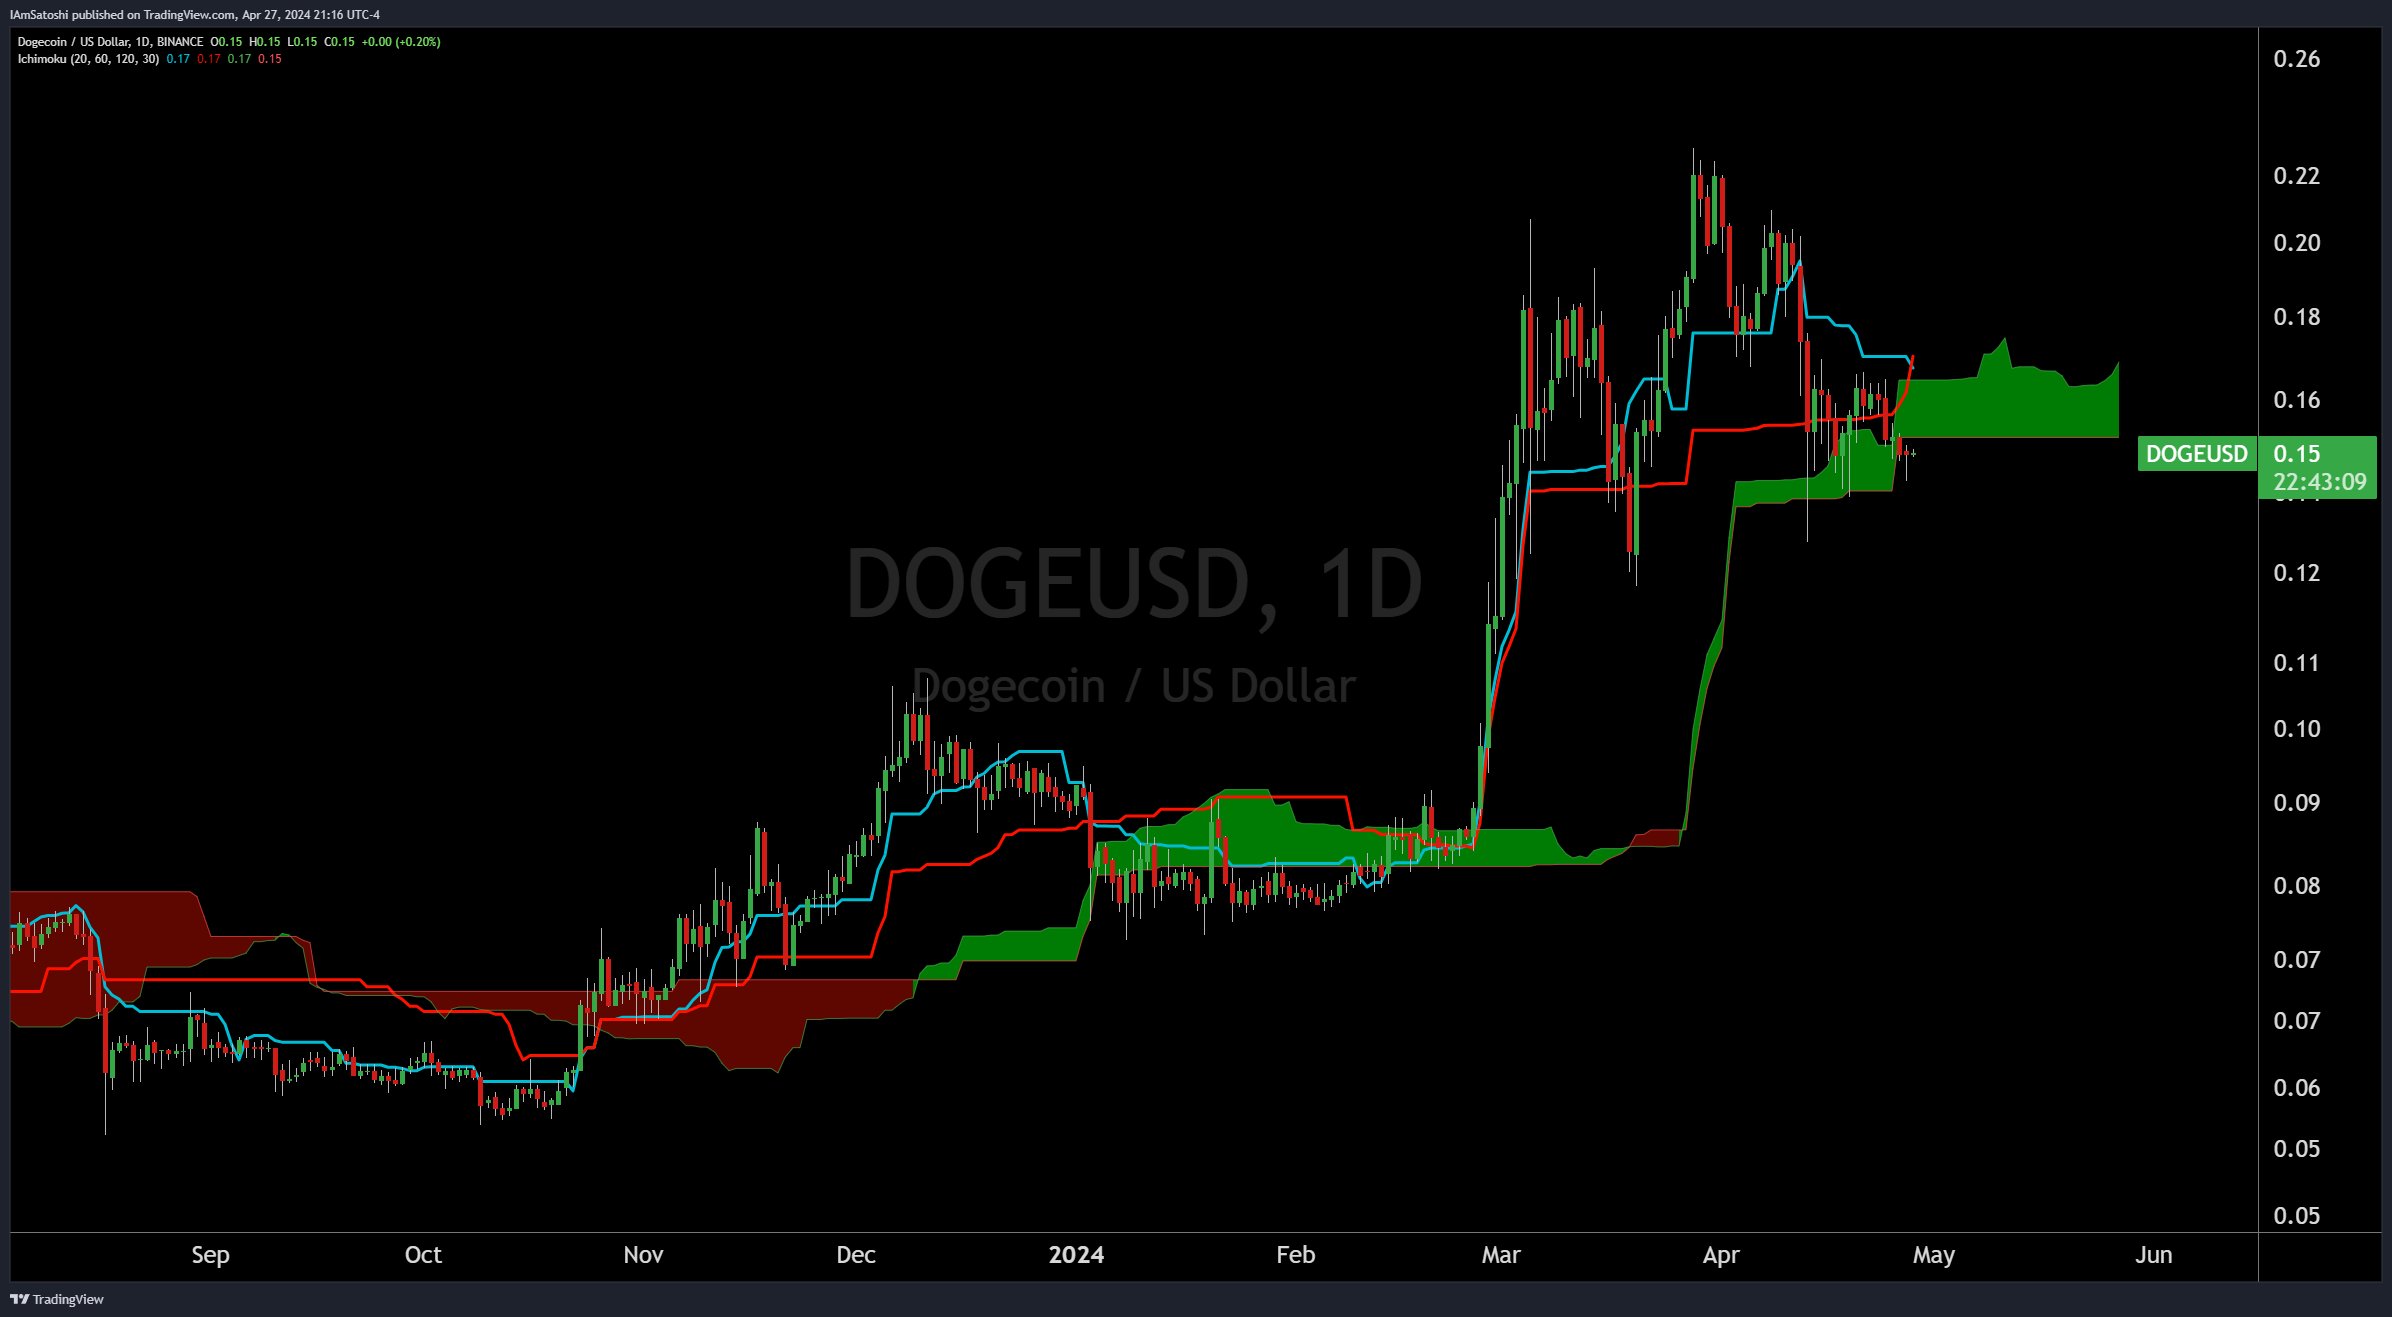
Crypto analyst Josh Olszewicz issues a warning of an impending Dogecoin price crash. His analysis relies on the Ichimoku Cloud indicator, which provides insights into support/resistance levels, momentum, and trend direction.
暗号アナリストのジョシュ・オルゼウィッチ氏は、ドージコインの価格暴落が差し迫っていると警告を発している。彼の分析は、サポート/レジスタンスレベル、勢い、トレンドの方向性に関する洞察を提供する一目雲指標に基づいています。
Bearish Signals for Dogecoin
ドージコインの弱気シグナル
Olszewicz identifies two specific technical phenomena on the 1-day (1D) chart of DOGE against the US dollar (DOGE/USD):
オルシェヴィッチ氏は、DOGE の対米ドル (DOGE/USD) の 1 日 (1D) チャートで 2 つの特定のテクニカル現象を特定しています。
1. Bearish TK Cross: The bearish crossover between the Tenkan-Sen (conversion line) and the Kijun-Sen (baseline) within the Ichimoku Cloud system indicates that short-term prices are falling below the base level of prices over the past month, suggesting further downward movement. 
1. 弱気のTKクロス:一目瞭然雲システム内の騰関線(転換線)と基準線(基準線)の間の弱気のクロスオーバーは、短期価格が過去1か月間価格の基準値を下回っていることを示します。さらなる下落を示唆しています。
2. Bearish Kumo Breakout: The 'Kumo' (cloud) represents a key area on the chart that can act as support or resistance. A 'bearish Kumo breakout' implies that the price has broken through the cloud downwards, confirming a bearish trend. The price below the Kumo indicates negative market sentiment, with the Kumo now likely acting as resistance to upward price movement. 
2. 弱気の雲のブレイクアウト: 「雲」(雲) は、サポートまたはレジスタンスとして機能するチャート上の重要な領域を表します。 「弱気雲のブレイクアウト」は、価格が雲を下方に突き抜け、弱気傾向を確認したことを意味します。 Kumo を下回る価格は否定的な市場センチメントを示しており、現在 Kumo は価格上昇に対する抵抗として機能している可能性があります。
40% Price Crash Looming?
40%の価格暴落が迫っている?
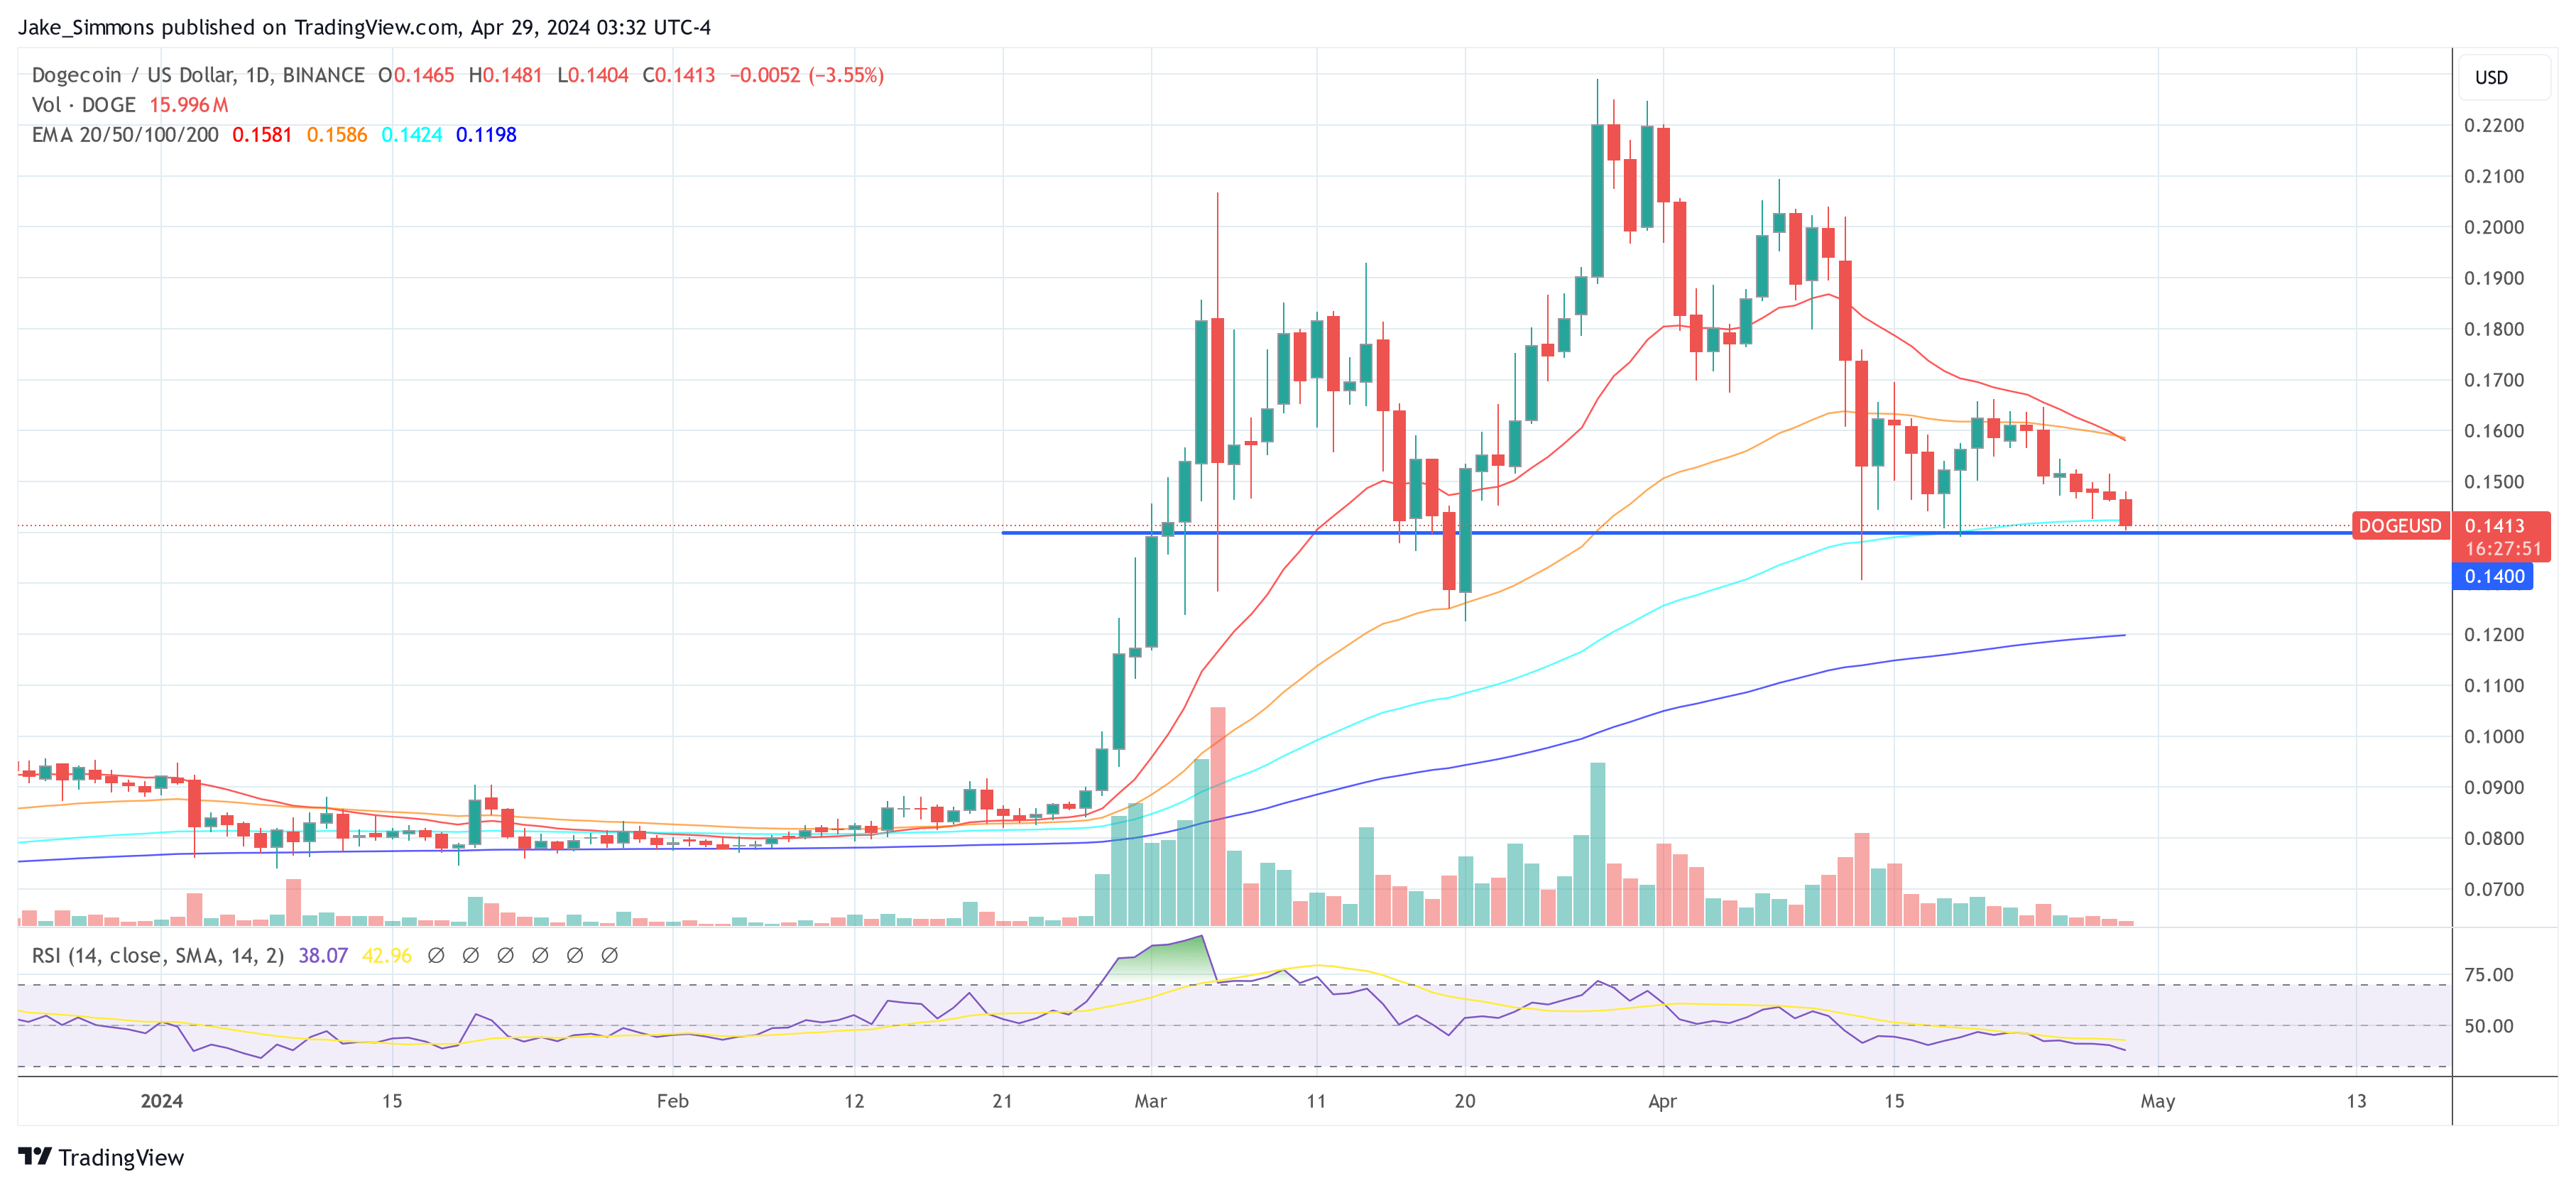
These technical signals reinforce Olszewicz's previous DOGE price analysis, which identified a potential Head and Shoulders (H&S) formation on the 12-hour chart. If Dogecoin's price breaks below $0.14, the H&S pattern could be validated, leading to a potential sell-off towards $0.10 to $0.09. This target area aligns with Fibonacci extension levels, suggesting a price crash of around 40%.
これらのテクニカルシグナルは、12時間足チャートで潜在的なヘッドアンドショルダー(H&S)形成を特定したオルシェヴィッチ氏の以前のDOGE価格分析を補強するものです。ドージコインの価格が0.14ドルを下回った場合、H&Sパターンが検証され、0.10ドルから0.09ドルに向けて下落する可能性があります。この目標領域はフィボナッチエクステンションレベルと一致しており、約40%の価格暴落を示唆しています。
Cautionary Signal
警告信号
While the H&S pattern has not yet been confirmed, the presence of the bearish TK cross and Kumo breakout serves as a cautionary signal for the market. Market participants should closely monitor the $0.14 level, as a break below could trigger the anticipated decline.
H&S パターンはまだ確認されていませんが、弱気の TK クロスと雲のブレイクアウトの存在は市場への警戒信号として機能します。市場参加者は0.14ドルの水準を注意深く監視する必要がある。これを下回ると予想される下落を引き起こす可能性がある。
At press time, DOGE traded at $0.1413.
記事執筆時点では、DOGEは0.1413ドルで取引されていました。
Disclaimer: This article is for educational purposes only and does not constitute financial advice. Investing carries risks, and you should always conduct your own research before making any investment decisions.
免責事項: この記事は教育のみを目的としており、財務上のアドバイスを構成するものではありません。投資にはリスクが伴うため、投資を決定する前に必ずご自身で調査を行う必要があります。


 TheNewsCrypto
 CFN
CFN DogeHome
 Optimisus
 Crypto News Land
 Optimisus
 Cryptopolitan_News


