,You can also read this news on COINTURK NEWS: Bitcoin Leads Market Surge, Boosting Investor Confidence
,COINTURK NEWS에서도 이 소식을 읽을 수 있습니다: 비트코인이 시장 급등을 주도하여 투자자 신뢰도 제고
The rise in the cryptocurrency market led by Bitcoin continues to bring joy to many investors. Although the altcoin market lags behind Bitcoin in this process, some altcoin projects continue to experience significant rises. So, what is happening with TON, DOGE, and SHIB? We analyze detailed chart analysis and important support and resistance levels.
비트코인이 주도하는 암호화폐 시장의 상승은 많은 투자자들에게 계속해서 기쁨을 안겨주고 있습니다. 이 과정에서 알트코인 시장은 비트코인에 비해 뒤떨어져 있지만 일부 알트코인 프로젝트는 계속해서 상당한 상승을 경험하고 있습니다. 그렇다면 TON, DOGE, SHIB에서는 무슨 일이 일어나고 있는 걸까요? 상세한 차트 분석과 주요 지지 및 저항 수준을 분석합니다.
TON Chart Analysis
TON 차트 분석
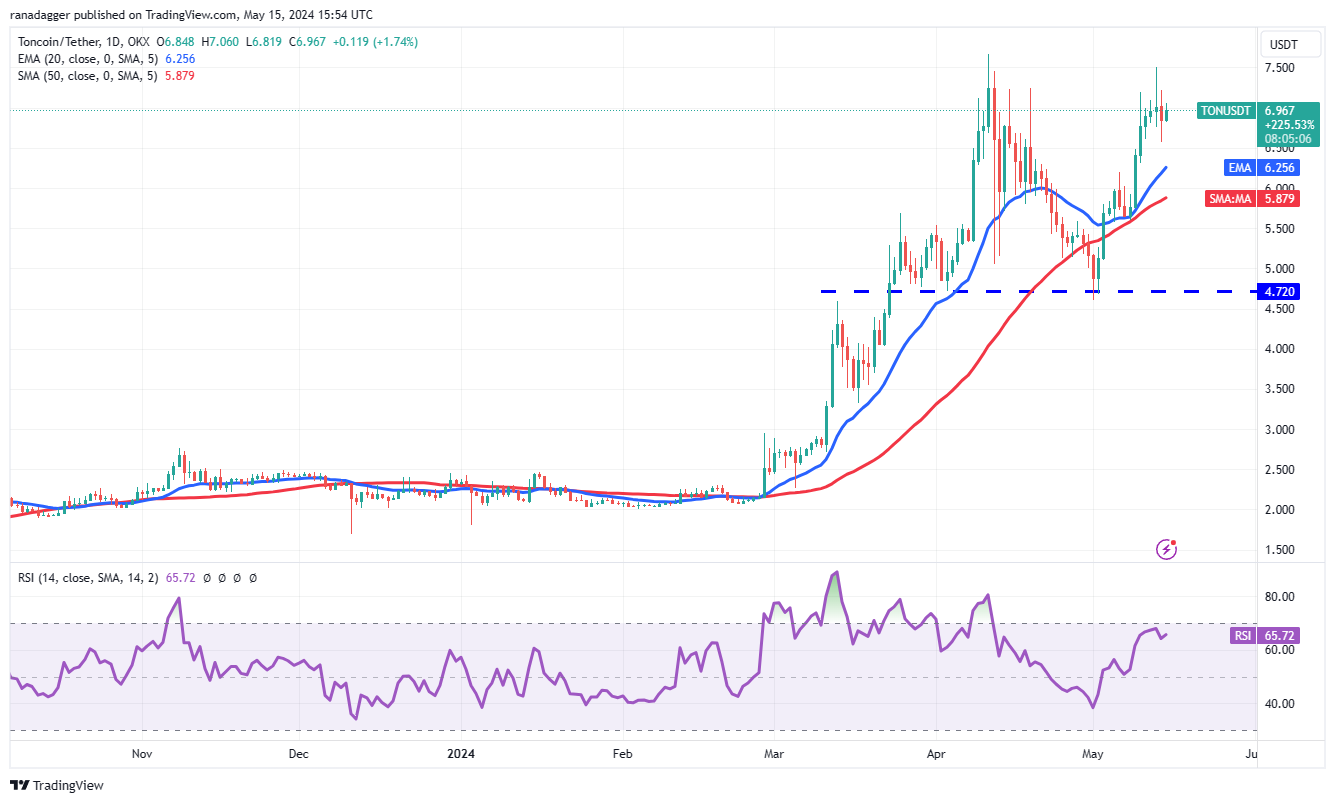
Buyers tried to push Toncoin (TON) above the $7.67 resistance on May 13, but the long wick on the candlestick indicates selling at higher levels. A small advantage in favor of the bulls is that they have not left much room for the bears. This suggests that the bulls might make another attempt at the overall resistance.
구매자들은 5월 13일에 Toncoin (TON)을 $7.67 저항선 위로 밀려고 시도했지만 캔들스틱의 긴 심지는 더 높은 수준에서 매도했음을 나타냅니다. 황소에게 유리한 작은 이점은 곰이 들어갈 공간을 많이 남겨두지 않는다는 것입니다. 이는 황소가 전반적인 저항에 대해 또 다른 시도를 할 수 있음을 시사합니다.

If buyers keep the price above $7.67, it could signal the resumption of the uptrend, and the TON/USDT pair could rise to $9. If the price declines from the current level and falls below the moving averages, this positive view could become invalid in the short term.
구매자가 가격을 $7.67 이상으로 유지하면 상승 추세의 재개 신호를 보낼 수 있으며 TON/USDT 쌍은 $9까지 상승할 수 있습니다. 가격이 현재 수준에서 하락하고 이동 평균 아래로 떨어지면 이러한 긍정적인 견해는 단기적으로 무효화될 수 있습니다.
DOGE Chart Analysis
DOGE 차트 분석
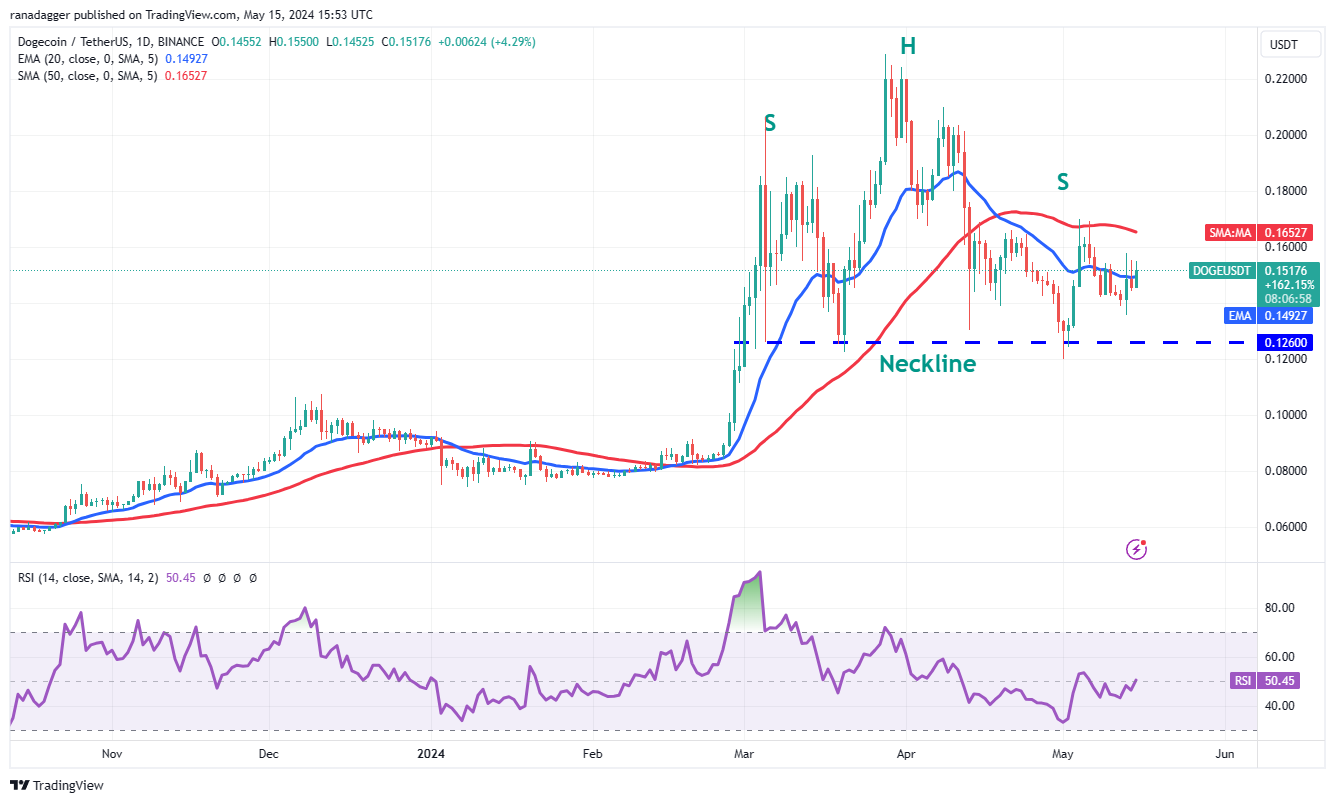
Bulls are trying to prevent Dogecoin from slipping below the neckline and completing a bearish head-and-shoulders pattern. The 20-day flat EMA at $0.15 and the RSI near the midpoint indicate range-bound action in the near term. If the price rises above the 20-day EMA, the DOGE/USDT pair could reach the 50-day SMA at $0.17.
강세론자들은 Dogecoin이 네크라인 아래로 미끄러져 하락하는 머리-어깨 패턴을 완성하는 것을 막으려고 노력하고 있습니다. $0.15의 20일 고정 EMA와 중간 지점 근처의 RSI는 단기적으로 범위 제한 조치를 나타냅니다. 가격이 20일 EMA 이상으로 상승하면 DOGE/USDT 쌍은 $0.17에 50일 SMA에 도달할 수 있습니다.

This is an important level for the bears to defend because a break above it could pave the way for a rise to $0.21. If the bears push the price below the neckline of the H&S pattern, they could take control and initiate a drop to $0.08.
이 수준을 돌파하면 $0.21까지 상승할 수 있기 때문에 이는 하락세가 방어해야 할 중요한 수준입니다. 하락세가 H&S 패턴의 네크라인 아래로 가격을 밀어붙이면 통제력을 확보하여 $0.08까지 하락할 수 있습니다.
SHIB Chart Analysis
SHIB 차트 분석
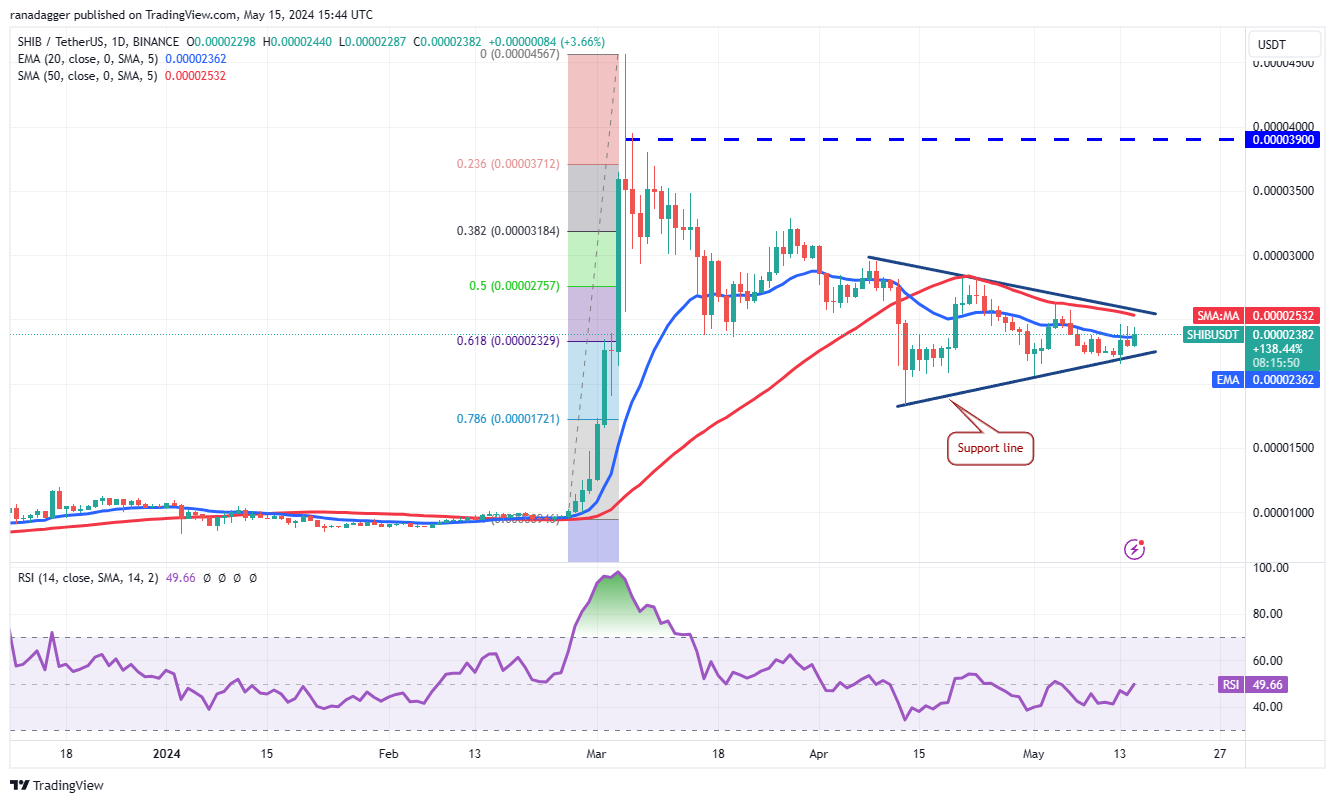
Bulls successfully defended the support line of the symmetrical triangle pattern in Shiba Inu on May 13. The flattening 20-day EMA and the RSI near the midpoint do not provide a clear advantage to either the bulls or the bears. It is difficult to predict the direction of the breakout, so it might be better to wait for the price to move above or below the triangle before making large investments.
황소는 5월 13일 시바견의 대칭 삼각형 패턴 지지선을 성공적으로 방어했습니다. 평탄한 20일 EMA와 중간 지점 근처의 RSI는 황소나 곰 모두에게 확실한 이점을 제공하지 않습니다. 돌파 방향을 예측하기 어렵기 때문에 대규모 투자를 하기 전에 가격이 삼각형 위나 아래로 움직일 때까지 기다리는 것이 더 나을 수도 있습니다.

A breakout above the triangle would indicate that the correction phase might be over. The SHIB/USDT pair could rise to $0.000030 and then to $0.000033. Conversely, a breakdown below the triangle could open the doors for a drop to the 78.6% Fibonacci retracement level at $0.000017.
삼각형 위의 돌파는 조정 단계가 끝났음을 나타냅니다. SHIB/USDT 쌍은 $0.000030까지 상승한 다음 $0.000033까지 상승할 수 있습니다. 반대로, 삼각형 아래로 붕괴되면 $0.000017의 78.6% 피보나치 되돌림 수준까지 하락할 수 있는 문이 열릴 수 있습니다.
The post first appeared on COINTURK NEWS: Bitcoin Leads Market Surge, Boosting Investor Confidence
해당 게시물은 COINTURK NEWS에 처음 게재되었습니다: 비트코인이 시장 급등을 주도하여 투자자 신뢰도 제고


 DogeHome
 Cryptopolitan
 crypto.ro English
 Crypto News Land
 ETHNews
 CFN
CFN U_Today


