,You can also read this news on COINTURK NEWS: Bitcoin Leads Market Surge, Boosting Investor Confidence
,您也可以在COINTURK NEWS上閱讀這則新聞:比特幣引領市場飆升,提振投資者信心
The rise in the cryptocurrency market led by Bitcoin continues to bring joy to many investors. Although the altcoin market lags behind Bitcoin in this process, some altcoin projects continue to experience significant rises. So, what is happening with TON, DOGE, and SHIB? We analyze detailed chart analysis and important support and resistance levels.
以比特幣為首的加密貨幣市場的崛起持續給眾多投資者帶來歡樂。儘管在這過程中山寨幣市場落後於比特幣,但一些山寨幣計畫仍持續大幅上漲。那麼,TON、DOGE 和 SHIB 發生了什麼事?我們分析詳細的圖表分析以及重要的支撐位和阻力位。
TON Chart Analysis
TON圖表分析
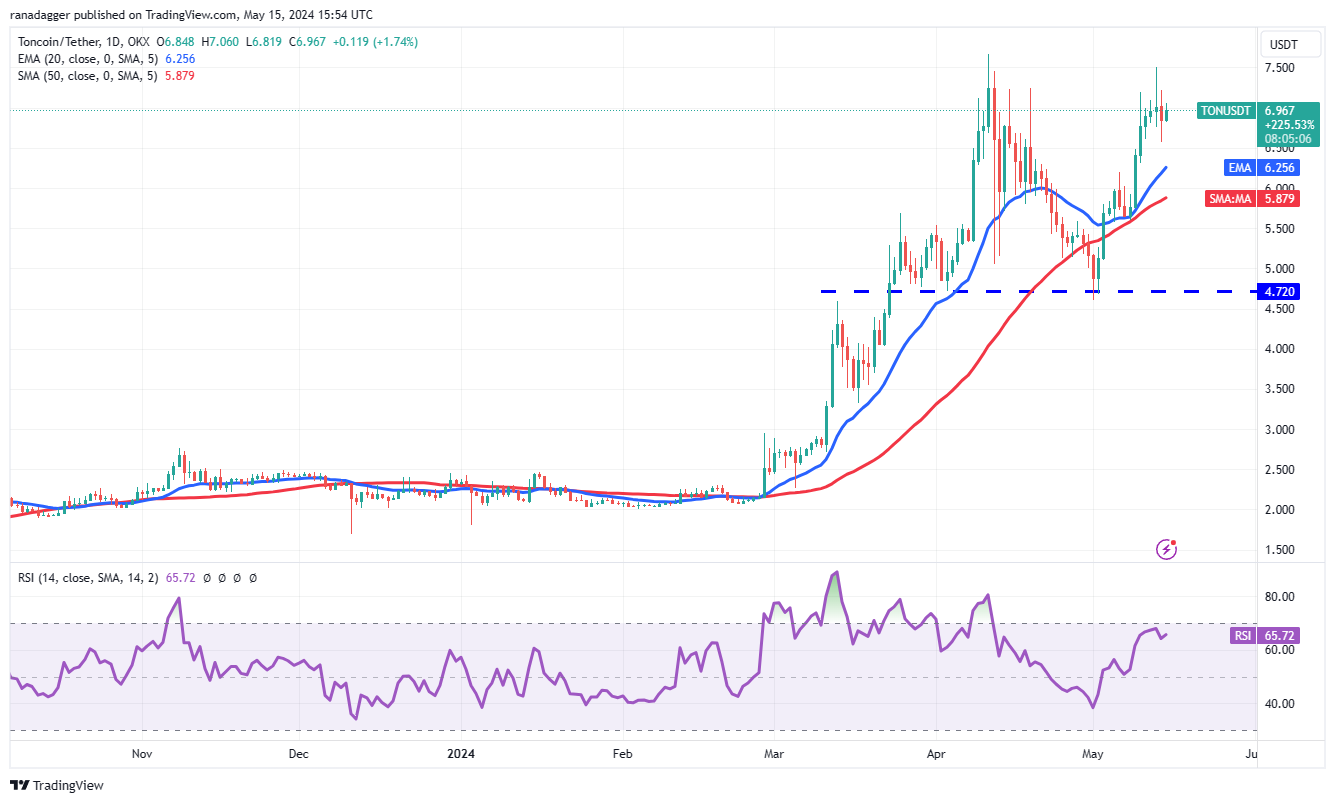
Buyers tried to push Toncoin (TON) above the $7.67 resistance on May 13, but the long wick on the candlestick indicates selling at higher levels. A small advantage in favor of the bulls is that they have not left much room for the bears. This suggests that the bulls might make another attempt at the overall resistance.
5 月 13 日,買家試圖將 Toncoin (TON) 推升至 7.67 美元阻力位之上,但燭台上的長影線表明在更高水平上出現拋售。有利於多頭的一個小優點是,他們沒有給空頭留下太多空間。這表明多頭可能會再次嘗試整體阻力。

If buyers keep the price above $7.67, it could signal the resumption of the uptrend, and the TON/USDT pair could rise to $9. If the price declines from the current level and falls below the moving averages, this positive view could become invalid in the short term.
如果買家將價格維持在 7.67 美元以上,則可能預示著上漲趨勢的恢復,TON/USDT 貨幣對可能會上漲至 9 美元。如果價格從目前水準下跌並跌破移動平均線,這種正面觀點可能在短期內失效。
DOGE Chart Analysis
DOGE圖表分析
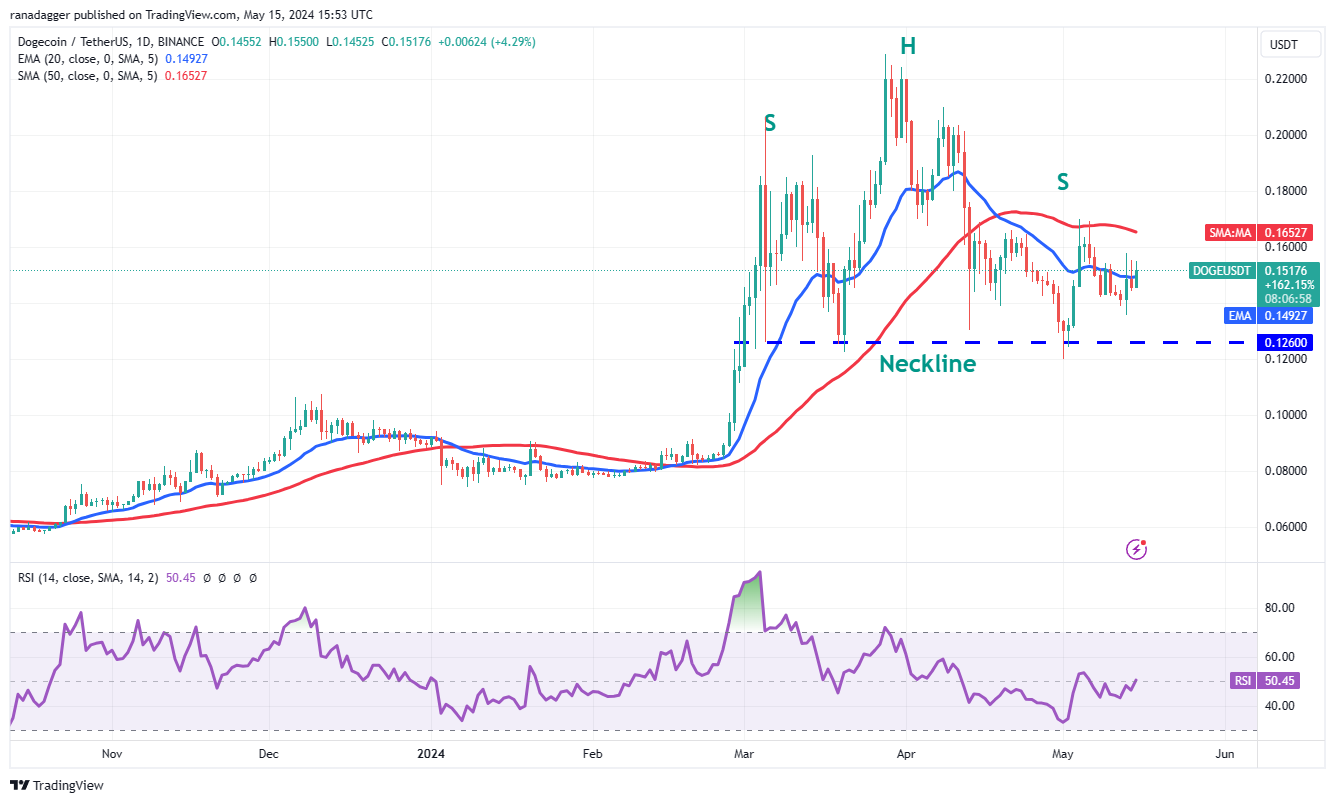
Bulls are trying to prevent Dogecoin from slipping below the neckline and completing a bearish head-and-shoulders pattern. The 20-day flat EMA at $0.15 and the RSI near the midpoint indicate range-bound action in the near term. If the price rises above the 20-day EMA, the DOGE/USDT pair could reach the 50-day SMA at $0.17.
多頭正試圖阻止狗狗幣跌破頸線並完成看跌的頭肩形態。 20 日均線均線位於 0.15 美元,RSI 接近中點,顯示近期將出現區間波動。如果價格升至 20 日均線上方,DOGE/USDT 貨幣對可能會觸及 0.17 美元的 50 日均線。

This is an important level for the bears to defend because a break above it could pave the way for a rise to $0.21. If the bears push the price below the neckline of the H&S pattern, they could take control and initiate a drop to $0.08.
對於空頭來說,這是一個重要的防守水平,因為突破該水平可能為上漲至 0.21 美元鋪平道路。如果空頭將價格推至 H&S 形態的頸線以下,他們可能會控制局面並開始跌至 0.08 美元。
SHIB Chart Analysis
SHIB圖表分析
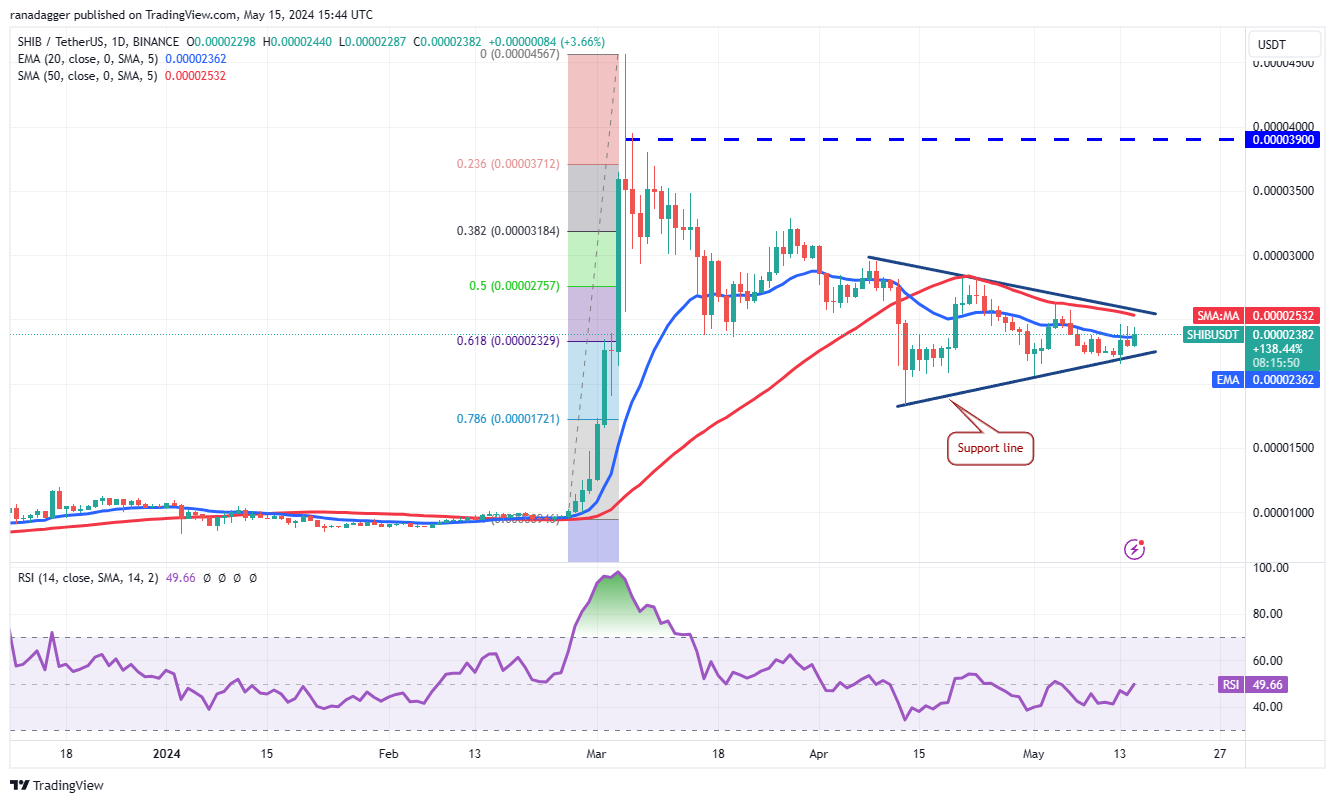
Bulls successfully defended the support line of the symmetrical triangle pattern in Shiba Inu on May 13. The flattening 20-day EMA and the RSI near the midpoint do not provide a clear advantage to either the bulls or the bears. It is difficult to predict the direction of the breakout, so it might be better to wait for the price to move above or below the triangle before making large investments.
5月13日,多頭成功守住了柴犬對稱三角形形態的支撐線。很難預測突破的方向,因此最好等待價格移動到三角形之上或之下,然後再進行大量投資。

A breakout above the triangle would indicate that the correction phase might be over. The SHIB/USDT pair could rise to $0.000030 and then to $0.000033. Conversely, a breakdown below the triangle could open the doors for a drop to the 78.6% Fibonacci retracement level at $0.000017.
突破三角形上方將表示修正階段可能已經結束。 SHIB/USDT 貨幣對可能會升至 0.000030 美元,然後升至 0.000033 美元。相反,跌破三角形可能會為跌至 78.6% 斐波那契回檔位 0.000017 美元打開大門。
The post first appeared on COINTURK NEWS: Bitcoin Leads Market Surge, Boosting Investor Confidence
該貼文首次出現在 COINTURK 新聞上:比特幣引領市場飆升,提振投資者信心


 Optimisus
 Cryptopolitan_News
 DogeHome
 Cryptopolitan
 crypto.ro English
 Crypto News Land
 ETHNews


