Bitcoin Price Surges to New Highs
비트코인 가격이 새로운 최고점으로 급등
The price of Bitcoin surged 7.5% in the past 24 hours, reaching $102,507 as of 11:03 p.m. EST, with trading volume jumping 49% to $130 billion.
비트코인 가격은 지난 24시간 동안 7.5% 급등해 오후 11시 3분 기준 102,507달러에 이르렀다. EST의 거래량은 49% 증가한 1,300억 달러를 기록했습니다.
Bitcoin broke its previous all-time high of $99,588 and surpassed the $100,000 milestone. It recorded a new all-time high of $103,679, recovering from its recent pullback since last week.
비트코인은 이전 최고치인 99,588달러를 경신하고 100,000달러를 넘어섰습니다. 지난주 이후 최근 하락세에서 회복해 사상 최고치인 103,679달러를 기록했습니다.
Trump Nominates Pro-Crypto Candidate for SEC
트럼프, SEC에 암호화폐 지지자 후보 지명
President-elect Donald Trump nominated Patomak Global Partners CEO Paul Atkins as the next Chairman of the Securities and Exchange Commission (SEC). Atkins is widely regarded as pro-crypto, and his nomination sent a positive signal to the crypto market.
도널드 트럼프 대통령 당선인은 Patomak Global Partners의 폴 앳킨스(Paul Atkins) CEO를 차기 증권거래위원회(SEC) 의장으로 지명했습니다. Atkins는 암호화폐 지지자로 널리 알려져 있으며, 그의 지명은 암호화폐 시장에 긍정적인 신호를 보냈습니다.
Bitcoin Price Technical Analysis
비트코인 가격 기술적 분석
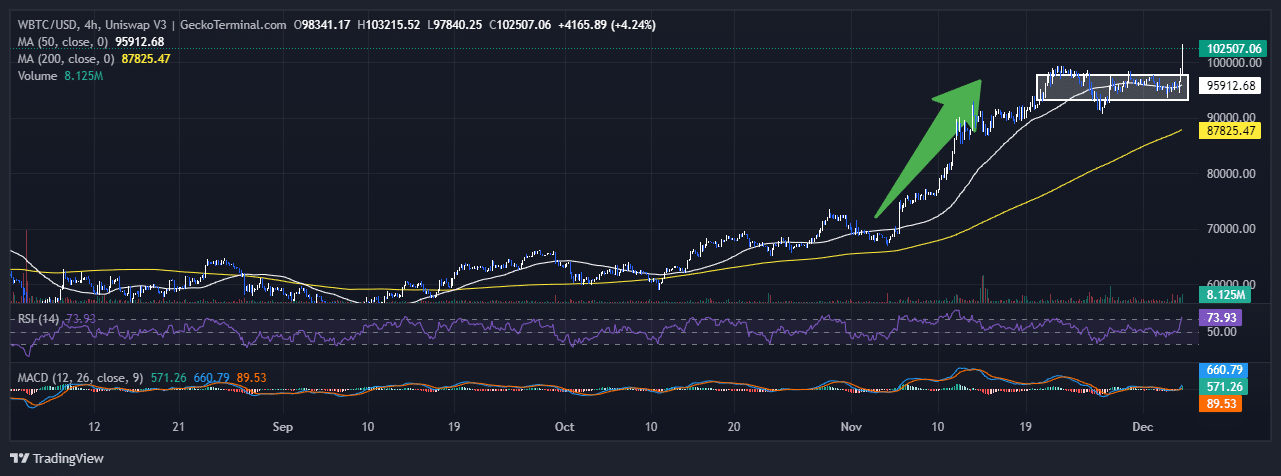
The Bitcoin price analysis on a 4-hour timeframe shows strong bullish momentum over recent weeks, followed by consolidation near the psychological resistance level of $96,000.
4시간 단위의 비트코인 가격 분석은 최근 몇 주 동안 강력한 강세 모멘텀을 보였으며 이어서 심리적 저항 수준인 96,000달러 근처에서 통합이 이루어졌습니다.
The price is currently trading at $102,507, indicating a continued uptrend since early October. The 50-day Simple Moving Average (SMA) is at $95,912.68, providing short-term support, while the 200-day SMA is at $87,825.47, reflecting a strongly bullish trend.
가격은 현재 $102,507에 거래되고 있으며, 이는 10월 초 이후 지속적인 상승 추세를 나타냅니다. 50일 단순 이동 평균(SMA)은 $95,912.68로 단기 지지를 제공하고 있으며, 200일 SMA는 $87,825.47로 강력한 강세 추세를 반영하고 있습니다.
The Relative Strength Index (RSI) is at 73.93, suggesting that the asset is overbought. While this indicates strong buying pressure, it also suggests a potential pullback or consolidation in the short term.
상대강도지수(RSI)는 73.93으로 해당 자산이 과매수 상태임을 나타냅니다. 이는 강력한 매수 압력을 의미하지만 단기적으로는 잠재적인 하락 또는 통합을 암시하기도 합니다.
The Moving Average Convergence Divergence (MACD) line is at 660.79, above the signal line at 571.26, indicating continuing bullish momentum. However, the histogram is narrowing, suggesting that the momentum is slightly weakening, which could lead to consolidation.
이동 평균 수렴 발산(MACD) 선은 신호선 571.26보다 높은 660.79에 있어 지속적인 강세 모멘텀을 나타냅니다. 그러나 히스토그램이 좁아지고 있어 모멘텀이 약간 약화되고 있음을 시사하며 이는 횡보세로 이어질 수 있습니다.
Bitcoin Price Prediction
비트코인 가격 예측
The strong bullish momentum, indicated by the SMAs and MACD, suggests that Bitcoin's price is likely to continue breaking out above the consolidation zone. Continued buying pressure could drive the price up towards the $113,000 resistance level.
SMA와 MACD가 나타내는 강력한 강세 모멘텀은 비트코인 가격이 계속해서 횡보 구간을 넘어설 가능성이 있음을 시사합니다. 지속적인 매수 압력으로 인해 가격이 $113,000 저항 수준까지 상승할 수 있습니다.
However, the overbought RSI suggests a short-term pullback or sideways movement is possible before any further upward move. The lower boundary of the consolidation zone, around $93,000, acts as the next support zone in case of a price decline.
그러나 과매수 RSI는 추가 상승이 있기 전에 단기 하락 또는 횡보 움직임이 가능함을 시사합니다. 약 $93,000인 통합 구역의 하한선은 가격 하락 시 다음 지지 구역 역할을 합니다.


 DogeHome
 Coin_Gabbar
 Coincu
 BlockchainReporter
 CoinPedia News
 TheNewsCrypto
 CFN
CFN


