Dogecoin's Bullish Rally Continues
Dogecoin의 강세 랠리는 계속됩니다
Dogecoin's network strength is growing, as evidenced by a hashrate surge to 1.21 PH/s. This surge indicates strong miner confidence.
해시레이트가 1.21 PH/s로 급증한 것으로 입증되는 것처럼 Dogecoin의 네트워크 강도는 증가하고 있습니다. 이러한 급증은 채굴자의 강한 자신감을 나타냅니다.
Technical Indicators Point to Further Rally
기술적 지표는 추가 랠리를 시사합니다
Analysts have noted a bullish technical pattern in Dogecoin's price movement, called a hidden RSI divergence. This pattern suggests that the price is set to rally again.
분석가들은 숨겨진 RSI 다이버전스라고 불리는 Dogecoin의 가격 움직임에서 낙관적인 기술적 패턴을 지적했습니다. 이 패턴은 가격이 다시 반등할 것임을 시사합니다.
High Network Activity and Growth
높은 네트워크 활동 및 성장
Dogecoin's network activity has been consistently high in recent months, with peaks reaching up to 2 PH/s. This activity, combined with increased computational power, signifies periods of high miner participation and network security.
Dogecoin의 네트워크 활동은 최근 몇 달 동안 지속적으로 높았으며 최고치는 초당 2PH에 달했습니다. 증가된 계산 능력과 결합된 이러한 활동은 채굴자 참여도와 네트워크 보안이 높은 기간을 의미합니다.
Miners' Enthusiasm and Profitability
채굴자들의 열정과 수익성
The sustained high hashrate levels reveal the miners' enthusiasm for the profitability and potential of the Dogecoin blockchain.
지속적으로 높은 해시율 수준은 Dogecoin 블록체인의 수익성과 잠재력에 대한 채굴자들의 열정을 드러냅니다.
Google Trends Dominance
Google 트렌드의 지배력
Dogecoin's popularity is evident in its dominance over Cardano in Google Trends. Dogecoin's search interest spikes during major market events, indicating widespread attention.
Dogecoin의 인기는 Google 트렌드에서 Cardano를 압도한다는 점에서 분명하게 드러납니다. Dogecoin의 검색 관심도는 주요 시장 이벤트 기간 동안 급증하여 광범위한 관심을 나타냅니다.
Consolidation and Potential Accumulation
통합 및 잠재적 축적
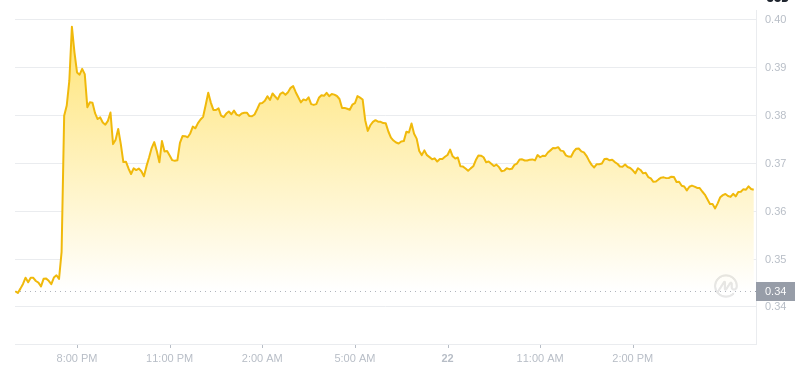
After a recent surge, Dogecoin is consolidating at around $0.37795. This consolidation may represent a period of accumulation, potentially leading to a breakout and a rally towards $0.60000.
최근 급등 이후 Dogecoin은 약 $0.37795에 통합되고 있습니다. 이러한 통합은 누적 기간을 나타낼 수 있으며 잠재적으로 $0.60000를 향한 돌파 및 반등으로 이어질 수 있습니다.
Technical Analysis
기술적 분석
The current price is supported by the 50 SMA at $0.37852 and the 100 SMA at $0.30255. The accumulation/distribution trend is positive, indicating steady accumulation.
현재 가격은 50 SMA의 경우 $0.37852, 100 SMA의 경우 $0.30255입니다. 축적/분배 추세는 긍정적이며 꾸준한 축적을 나타냅니다.
Trading Dynamics
거래 역학
The balance between buyers and sellers is creating a tug-of-war, with potential for a breakout. Volume spikes can confirm a breakout above $0.60000, while decreasing volume may indicate a sideways trend.
구매자와 판매자 사이의 균형이 줄다리기를 만들고 있으며 돌파 가능성이 있습니다. 거래량 급증은 $0.60000 이상의 돌파를 확인할 수 있는 반면, 거래량 감소는 횡보 추세를 나타낼 수 있습니다.


 Crypto Intelligence
 Bitcoin Sistemi EN
 CoinsProbe
 CryptoPotato_News
 CoinsProbe
 DogeHome
 Coin_Gabbar
 Crypto News Flash
 Optimisus


