The post Can DOGE Price Defend $0.7 Amidst Current Market Turmoil? appeared first on Coinpedia Fintech News
게시물 현재 시장 혼란 속에서 DOGE 가격이 0.7달러를 방어할 수 있습니까? Coinpedia Fintech News에 처음 등장
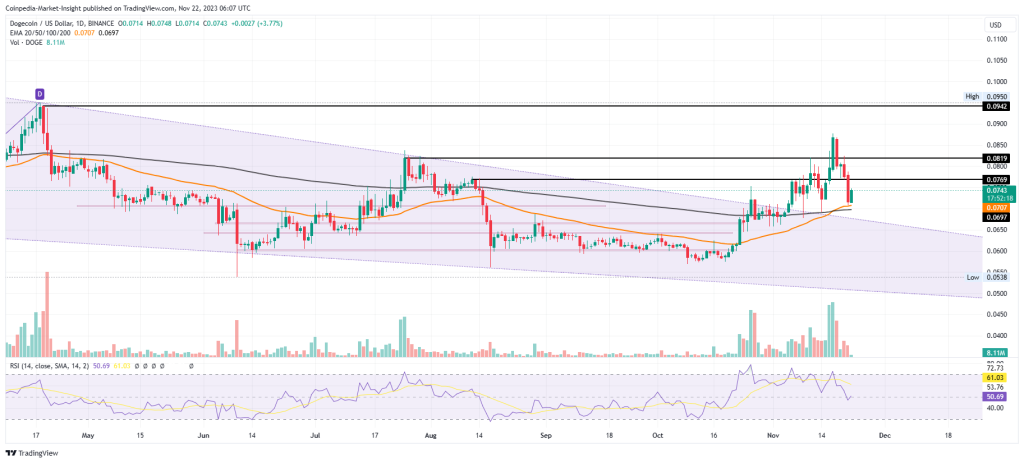
On November 18, the DOGE price witnessed a sharp reversal from the $0.0876 mark amid increasing uncertainties in the market. This reversal picked up additional momentum when the news spread about the Binance CEO, Changpeng Zhao resigning from his position. In the last five days, the Dogecoin price has declined 14% to currently trade at $0.074.
However, a look at the daily timeframe chart shows this correction is part of the wedge breakout, indicating the Dogecoin price prediction is bullish in the mid-term.
Multiple Supports Prevent Dogecoin From Major Correction
여러 지원으로 Dogecoin의 주요 수정 방지

Source – Tradingview
출처 – 트레이딩뷰
For nearly a year, the Dogecoin price has been walking a steady downtrend under the development of a falling wedge pattern. In theory, this chart pattern indicates the exhaustion of bullish momentum, as it is often spotted at the maturity of a downtrend.
거의 1년 동안 Dogecoin 가격은 떨어지는 쐐기 패턴의 발전으로 꾸준한 하락세를 걷고 있습니다. 이론적으로 이 차트 패턴은 하락 추세가 성숙되는 지점에서 흔히 발견되므로 강세 모멘텀이 고갈되었음을 나타냅니다.
Amid the early November recovery, the DOGE price provided a bullish breakout from this upper trendline and reached a high of $0.0876. However, amid the recent downturn in the crypto market, DOGE price witnessed a sharp lead-off reversal to reach the current trading price of $0.074.
The declining price is likely to retest the upper-trendline of the wedge pattern, this time as a potential support. In addition, this level coinciding with the 50 and 200-day EMA and 61.8% Fibonacci retracement level creates a strong support zone for buyers.
하락하는 가격은 이번에는 잠재적인 지지선으로 웨지 패턴의 상단 추세선을 다시 테스트할 가능성이 높습니다. 또한 50일 및 200일 EMA 및 61.8% 피보나치 되돌림 수준과 일치하는 이 수준은 구매자에게 강력한 지지 영역을 만듭니다.
If the buyers manage to sustain this level, the post-correction rally could surge 60% higher to hit the $0.118 mark.
구매자가 이 수준을 유지한다면 조정 후 랠리는 60% 더 급등하여 0.118달러를 기록할 수 있습니다.
Technical indicators:
RSI indicator: The daily RSI slope wavering at 50% reflects a neutral stance but is more inclined to negative sentiment with the current downturn.
EMA: A bullish crossover between the 50-and-200-day EMA around $0.07 should create an additional layer of support for buyers.
Will the DOGE Price Fall Back to $0.57?
DOGE 가격이 0.57달러로 다시 하락할까요?
If the market sentiment worsens, the Dogecoin price breakdown from the $0.07 threshold will pave the way for significant downfalls. Losing this multiple support at once could intensify the supply pressure and tumble the coin price 17% down to the October low of around $0.057,
시장 정서가 악화되면 0.07달러 기준점에서 도지코인 가격이 하락하여 상당한 하락의 길을 열게 됩니다. 이 다중 지원을 한 번에 잃으면 공급 압력이 강화되고 코인 가격이 10월 최저치인 약 $0.057까지 17% 하락할 수 있습니다.


 U_Today
 Thecoinrepublic.com
 DogeHome
 Optimisus
 Optimisus
 DeFi Planet
 Crypto Daily™
 BlockchainReporter
 TheCoinrise Media


