Dogecoin Attracts Investors amid Price Surge
Dogecoin은 가격 급등 속에서 투자자를 유치합니다
Dogecoin (DOGE) has drawn investor interest due to its recent price appreciation. However, current indicators suggest a potential shift in momentum.
Dogecoin(DOGE)은 최근 가격 상승으로 인해 투자자들의 관심을 끌었습니다. 그러나 현재 지표들은 모멘텀의 잠재적인 변화를 암시하고 있습니다.
Dogecoin's Holding Period
Dogecoin 보유 기간
Holding period measures the average time a token is held without transaction activity. In the crypto realm, this "HODLing" strategy involves holding assets despite price fluctuations.
보유 기간은 거래 활동 없이 토큰이 보유되는 평균 시간을 측정합니다. 암호화폐 영역에서 이 "HODLing" 전략에는 가격 변동에도 불구하고 자산을 보유하는 것이 포함됩니다.
Over the past week, Dogecoin's holding period has increased by 387.03%, indicating strong investor adherence to HODLing. Minimal token movement suggests limited selling pressure, but increased transaction activity could signify sporadic sales.
지난 주 동안 Dogecoin의 보유 기간은 387.03% 증가하여 HODLing에 대한 투자자의 강력한 지지를 나타냅니다. 최소한의 토큰 이동은 제한된 판매 압력을 의미하지만 거래 활동의 증가는 산발적인 판매를 의미할 수 있습니다.
Sustained HODLing can enhance Dogecoin's stability. If buying pressure persists, the price may rise further. Currently, DOGE trades at $0.12 after experiencing a 20.78% decline over the past month. Trading volume has decreased by 33% during this period. However, this volume reduction might signal a weakening of the extended price downturn, providing potential for DOGE to recover.
지속적인 HODLing은 Dogecoin의 안정성을 향상시킬 수 있습니다. 매수 압력이 지속되면 가격이 더 오를 수 있습니다. 현재 DOGE는 지난 한 달간 20.78% 하락한 후 0.12달러에 거래되고 있습니다. 이 기간 거래량은 33% 감소했다. 그러나 이러한 수량 감소는 장기 가격 하락세의 약화를 의미하여 DOGE가 회복할 가능성을 제공할 수 있습니다.
Technical Analysis of DOGE
DOGE의 기술적 분석
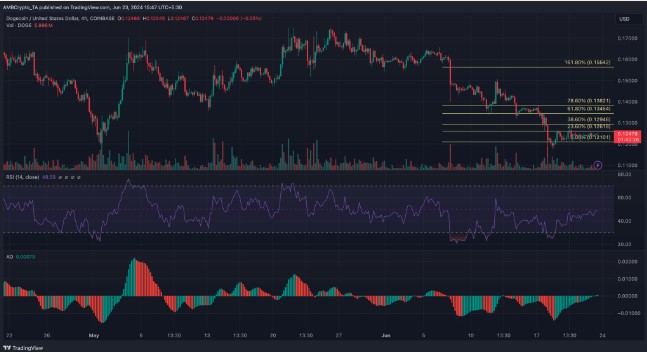
Technically, the DOGE/USD 4-hour chart indicates that the Awesome Oscillator (AO) has entered the positive region. AO gauges momentum, and its positive value suggests growing momentum for Dogecoin. Similarly, the Relative Strength Index (RSI) has risen but remains below the neutral 50.00 zone. This suggests the price may fluctuate around $0.12 momentarily. However, a breach above this level could trigger further price increases.
기술적으로 DOGE/USD 4시간 차트는 AO(Awesome Oscillator)가 플러스 영역에 진입했음을 나타냅니다. AO는 모멘텀을 측정하며, 양수 값은 Dogecoin의 모멘텀이 커지고 있음을 나타냅니다. 마찬가지로 상대강도지수(RSI)도 상승했지만 중립 영역인 50.00 영역 아래에 머물고 있습니다. 이는 가격이 순간적으로 0.12달러 정도 변동할 수 있음을 의미합니다. 그러나 이 수준을 초과하는 위반은 추가 가격 인상을 유발할 수 있습니다.
The Fibonacci Retracement indicator suggests potential price levels. The 61.8% Fib level is at $0.13, indicating DOGE's potential movement towards this level. In a bullish scenario, the price could reach $0.15.
피보나치 되돌림 지표는 잠재적인 가격 수준을 나타냅니다. 61.8% Fib 수준은 $0.13이며, 이는 DOGE가 이 수준을 향한 잠재적 움직임을 나타냅니다. 낙관적인 시나리오에서는 가격이 0.15달러에 도달할 수 있습니다.
The DAA metric measures active user count and provides buy/sell signals when compared to price. A price rise above DAA triggers a buy signal, while a DAA rise above price triggers a sell signal. Dogecoin's current price DAA deviation is -79.13%, implying lower network participation compared to price growth.
DAA 지표는 활성 사용자 수를 측정하고 가격과 비교할 때 구매/판매 신호를 제공합니다. 가격이 DAA보다 높으면 매수 신호가 발생하고, DAA가 가격보다 상승하면 매도 신호가 발생합니다. Dogecoin의 현재 가격 DAA 편차는 -79.13%이며, 이는 가격 상승에 비해 네트워크 참여가 낮다는 것을 의미합니다.
Disclaimer: 
부인 성명:


 Cointribune
 CoinPedia News
 CoinoMedia
 CoinEagle.com
 DogeHome
 Cointelegraph
 Cryptopolitan_News
 Optimisus
 Thecoinrepublic.com


