Indicators favor bullish surges for DOGE as it remains above the 200-day EMA, indicating stability in price movements. Booming network activity, with over 890K new addresses joining the Dogecoin blockchain in recent days, further supports this trend.
지표는 DOGE가 200일 EMA 위에 머물기 때문에 강세 급등을 선호하며 이는 가격 변동의 안정성을 나타냅니다. 최근 890,000개가 넘는 새로운 주소가 Dogecoin 블록체인에 합류하는 등 활발한 네트워크 활동이 이러한 추세를 더욱 뒷받침합니다.

Cryptos Headlines Platform Has Launched Its Native Token, Early Public Sale Is Live On CryptosHeadlinesToken.com
Cryptos Headlines 플랫폼은 기본 토큰을 출시했으며 초기 공개 판매는 CryptosHeadlinesToken.com에서 진행됩니다.
While most top cryptocurrencies saw minimal price changes on their daily charts, Dogecoin (DOGE) appears poised for significant price surges.
대부분의 상위 암호화폐는 일일 차트에서 최소한의 가격 변동을 보였지만 Dogecoin(DOGE)은 상당한 가격 급등이 예상되는 것으로 보입니다.
Dogecoin (DOGE) Technical Analysis: Potential Trends
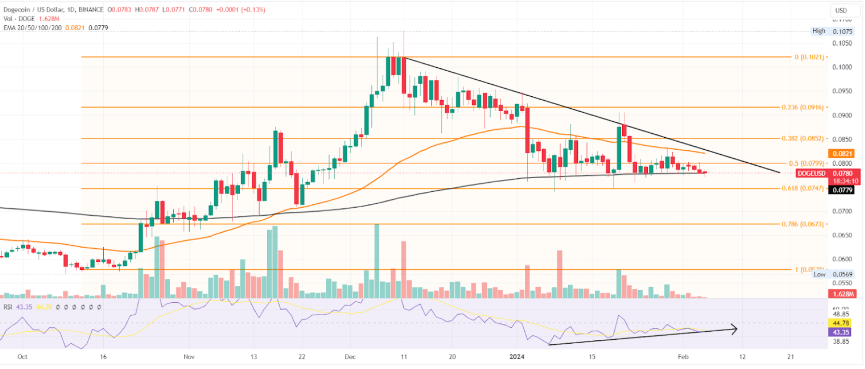
Dogecoin (DOGE) exhibits a descending triangle pattern on its chart, with the 200-day Exponential Moving Average (EMA) serving as its baseline. This pattern is characterized by lower highs, indicating potential downward pressure on prices. Additionally, the plunging trading volume suggests a continuation of sideways movement for DOGE prices.
Dogecoin(DOGE) 기술 분석: 잠재적 추세Dogecoin(DOGE)은 200일 지수 이동 평균(EMA)을 기준으로 차트에서 하강 삼각형 패턴을 나타냅니다. 이 패턴은 고점이 낮아지는 것이 특징이며 이는 가격에 잠재적인 하향 압력이 있음을 나타냅니다. 또한, 거래량 급감은 DOGE 가격의 횡보 움직임이 계속되고 있음을 시사합니다.

Source – TradingView
출처 – TradingView
Despite the descending triangle pattern, the daily chart reveals an increasing Relative Strength Index (RSI) divergence. This divergence suggests potential bullish surges for Dogecoin in the upcoming trading sessions. Currently trading around $0.07875, DOGE remains positioned beyond the 200-day EMA, indicating a level of strength in its price position.
하강하는 삼각형 패턴에도 불구하고 일일 차트에서는 상대강도지수(RSI) 차이가 증가하는 것을 보여줍니다. 이러한 차이는 다가오는 거래 세션에서 Dogecoin의 잠재적인 강세 급증을 시사합니다. 현재 약 $0.07875에 거래되고 있는 DOGE는 200일 EMA를 넘어서는 위치를 유지하고 있으며 이는 가격 위치의 강도를 나타냅니다.
Dogecoin (DOGE) Network Activity Soars: New Users Propel Growth
Dogecoin (DOGE) has garnered attention for its exponential surge in network activity, driven by a record number of newly created wallets. In the past week alone, more than 890,000 new addresses have joined the DOGE ecosystem, marking an all-time high in user adoption.
도지코인(DOGE) 네트워크 활동 급증: 신규 사용자 성장 촉진 도지코인(DOGE)은 기록적인 신규 지갑 생성에 힘입어 네트워크 활동이 기하급수적으로 급증해 주목을 받았습니다. 지난 주에만 890,000개 이상의 새로운 주소가 DOGE 생태계에 합류하여 사용자 채택률이 사상 최고치를 기록했습니다.
This remarkable influx of new users aligns with Dogecoin’s impressive 86% adoption rate, as newcomers complete their initial transactions on the network. Catalysts such as the release of the Doom video game and the highly anticipated DOGE-1 launch have fueled this eye-catching growth.
이러한 놀라운 신규 사용자 유입은 신규 사용자가 네트워크에서 초기 거래를 완료함에 따라 Dogecoin의 인상적인 86% 채택률과 일치합니다. Doom 비디오 게임의 출시와 많은 기대를 모았던 DOGE-1 출시와 같은 촉매제가 이러한 눈길을 끄는 성장을 촉진했습니다.
While the price of the altcoin has not mirrored the surge in network activity, the influx of new participants could propel Dogecoin forward, especially amidst a broader market recovery.
알트코인의 가격은 네트워크 활동의 급증을 반영하지 못했지만, 새로운 참가자의 유입은 특히 광범위한 시장 회복 속에서 Dogecoin을 발전시킬 수 있습니다.
Also Read: Hedera (HBAR) Hits Record: 164M Daily Transactions; $2.9B Market Cap
또한 읽어 보세요: Hedera (HBAR) 기록 기록: 일일 거래 1억 6400만 건; 시가총액 29억 달러
Dogecoin (DOGE) Price Volatility: Analysts Predict Breakouts
Crypto analyst Ali predicts an imminent uptick in Dogecoin’s (DOGE) price volatility. According to Ali, the Bollinger Bands on the 4-hour chart are experiencing the tightest squeeze since October of the previous year. This suggests the potential for breakouts followed by rapid upswings in price.
Dogecoin(DOGE) 가격 변동성: 분석가들은 돌파를 예측합니다. Crypto 분석가 Ali는 Dogecoin(DOGE) 가격 변동성이 곧 상승할 것으로 예측합니다. 알리에 따르면 4시간 차트의 볼린저 밴드는 전년 10월 이후 가장 빡빡한 압박을 겪고 있습니다. 이는 돌파에 이어 가격이 급등할 가능성이 있음을 시사합니다.
Traders on the sidelines are advised to wait for a breakout in either direction before considering entry signals. This cautious approach acknowledges the uncertainty surrounding the direction of the impending price movement.
부업에 있는 거래자는 진입 신호를 고려하기 전에 어느 방향으로든 돌파를 기다리는 것이 좋습니다. 이러한 신중한 접근 방식은 임박한 가격 변동 방향을 둘러싼 불확실성을 인정합니다.
Narrowing Bollinger Bands are commonly used by analysts to anticipate low volatility periods followed by increased market activity. When bands tighten, it indicates price consolidation within a narrow range. Historically, such patterns have preceded significant price actions, making it a crucial indicator for investors to monitor.
축소 볼린저 밴드는 분석가들이 낮은 변동성 기간과 그에 따른 시장 활동 증가를 예측하기 위해 일반적으로 사용합니다. 밴드가 조여지면 좁은 범위 내에서 가격이 통합되었음을 나타냅니다. 역사적으로 이러한 패턴은 중요한 가격 변동보다 먼저 나타나기 때문에 투자자가 모니터링해야 하는 중요한 지표가 됩니다.
Important: Please note that this article is only meant to provide information and should not be taken as legal, tax, investment, financial, or any other type of advice.
중요: 이 문서는 정보 제공만을 목적으로 하며 법률, 세금, 투자, 금융 또는 기타 유형의 조언으로 받아들여서는 안 됩니다.


 TheCoinrise Media
 TheCoinrise Media
 TheCoinrise Media
 DogeHome
 Cryptopolitan_News
 Coin Edition
 BlockchainReporter
 crypto.news
 Crypto Daily™


