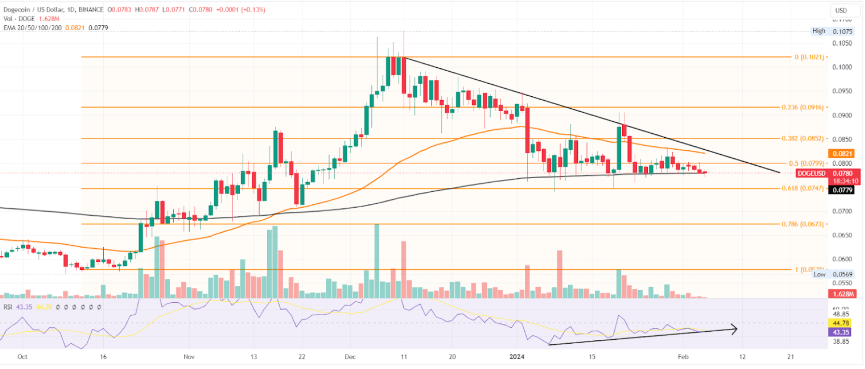
Indicators favor bullish surges for DOGE as it remains above the 200-day EMA, indicating stability in price movements. Booming network activity, with over 890K new addresses joining the Dogecoin blockchain in recent days, further supports this trend.
指標はDOGEが200日EMAを上回っており、価格変動の安定性を示しているため、強気の急騰を支持している。ここ数日で 89 万を超える新しいアドレスが Dogecoin ブロックチェーンに参加するなど、ネットワーク活動が活況を呈しており、この傾向がさらに裏付けられています。

Cryptos Headlines Platform Has Launched Its Native Token, Early Public Sale Is Live On CryptosHeadlinesToken.com
Cryptos Headlines プラットフォームがネイティブ トークンを開始、CryptosHeadlinesToken.com で初期公開セールが開始
While most top cryptocurrencies saw minimal price changes on their daily charts, Dogecoin (DOGE) appears poised for significant price surges.
上位の仮想通貨のほとんどは日次チャートで最小限の価格変動しか見られませんでしたが、ドージコイン (DOGE) は大幅な価格急騰の準備ができているようです。
Dogecoin (DOGE) Technical Analysis: Potential Trends
Dogecoin (DOGE) exhibits a descending triangle pattern on its chart, with the 200-day Exponential Moving Average (EMA) serving as its baseline. This pattern is characterized by lower highs, indicating potential downward pressure on prices. Additionally, the plunging trading volume suggests a continuation of sideways movement for DOGE prices.
ドージコイン (DOGE) テクニカル分析: 潜在的なトレンドドージコイン (DOGE) は、200 日間の指数移動平均 (EMA) をベースラインとして、チャート上で下降三角形のパターンを示しています。このパターンは高値が下がるという特徴があり、価格に対する潜在的な下押し圧力を示しています。さらに、取引高の急落は、DOGE価格の横ばいの動きが継続することを示唆しています。

Source – TradingView
出典 – TradingView
Despite the descending triangle pattern, the daily chart reveals an increasing Relative Strength Index (RSI) divergence. This divergence suggests potential bullish surges for Dogecoin in the upcoming trading sessions. Currently trading around $0.07875, DOGE remains positioned beyond the 200-day EMA, indicating a level of strength in its price position.
下降三角パターンにもかかわらず、日足チャートでは相対力指数 (RSI) の乖離が増大していることがわかります。この乖離は、今後の取引セッションでドージコインが強気で急騰する可能性を示唆しています。現在、DOGEは0.07875ドル付近で取引されており、依然として200日EMAを超えた位置にあり、その価格ポジションの強さを示しています。
Dogecoin (DOGE) Network Activity Soars: New Users Propel Growth
Dogecoin (DOGE) has garnered attention for its exponential surge in network activity, driven by a record number of newly created wallets. In the past week alone, more than 890,000 new addresses have joined the DOGE ecosystem, marking an all-time high in user adoption.
ドージコイン (DOGE) のネットワーク活動が急上昇: 新規ユーザーが成長を促進ドージコイン (DOGE) は、新しく作成されたウォレットの記録的な数によって引き起こされたネットワーク活動の急激な急増で注目を集めています。過去 1 週間だけでも、890,000 を超える新しいアドレスが DOGE エコシステムに加わり、ユーザーの採用率は過去最高を記録しました。
This remarkable influx of new users aligns with Dogecoin’s impressive 86% adoption rate, as newcomers complete their initial transactions on the network. Catalysts such as the release of the Doom video game and the highly anticipated DOGE-1 launch have fueled this eye-catching growth.
この目覚ましい新規ユーザーの流入は、新規ユーザーがネットワーク上で最初のトランザクションを完了するにつれて、Dogecoin の 86% という驚異的な普及率と一致しています。 Doom ビデオ ゲームのリリースや待望の DOGE-1 の発売などの触媒が、この目を引く成長を促進しました。
While the price of the altcoin has not mirrored the surge in network activity, the influx of new participants could propel Dogecoin forward, especially amidst a broader market recovery.
アルトコインの価格はネットワーク活動の急増を反映していないが、特に広範な市場回復の中で、新たな参加者の流入がドージコインを前進させる可能性がある。
Also Read: Hedera (HBAR) Hits Record: 164M Daily Transactions; $2.9B Market Cap
こちらもお読みください: Hedera (HBAR) のヒット記録: 1 日あたりのトランザクション数 1 億 6,400 万。時価総額 29 億ドル
Dogecoin (DOGE) Price Volatility: Analysts Predict Breakouts
Crypto analyst Ali predicts an imminent uptick in Dogecoin’s (DOGE) price volatility. According to Ali, the Bollinger Bands on the 4-hour chart are experiencing the tightest squeeze since October of the previous year. This suggests the potential for breakouts followed by rapid upswings in price.
ドージコイン(DOGE)の価格ボラティリティ:アナリストがブレイクアウトを予測 仮想通貨アナリストのアリ氏は、ドージコイン(DOGE)の価格ボラティリティが差し迫って上昇すると予測しています。アリ氏によると、4時間足チャートのボリンジャーバンドは前年10月以来最も厳しいスクイーズを経験しているという。これは、価格の急速な上昇に続くブレイクアウトの可能性を示唆しています。
Traders on the sidelines are advised to wait for a breakout in either direction before considering entry signals. This cautious approach acknowledges the uncertainty surrounding the direction of the impending price movement.
傍観しているトレーダーは、エントリーシグナルを検討する前に、どちらかの方向のブレイクアウトを待つことをお勧めします。この慎重なアプローチは、差し迫った価格変動の方向性をめぐる不確実性を認識しています。
Narrowing Bollinger Bands are commonly used by analysts to anticipate low volatility periods followed by increased market activity. When bands tighten, it indicates price consolidation within a narrow range. Historically, such patterns have preceded significant price actions, making it a crucial indicator for investors to monitor.
ナローイング ボリンジャー バンドは、ボラティリティが低い期間とそれに続く市場活動の増加を予測するためにアナリストによってよく使用されます。バンドがタイトになっている場合は、狭い範囲内で価格が堅調であることを示しています。歴史的に、このようなパターンは重要な値動きに先立って発生しており、投資家が監視する重要な指標となっています。
Important: Please note that this article is only meant to provide information and should not be taken as legal, tax, investment, financial, or any other type of advice.
重要: この記事は情報提供のみを目的としており、法律、税金、投資、財務、その他の種類のアドバイスとして受け取られるべきではないことに注意してください。


 DogeHome
 Cryptopolitan_News
 Coin Edition
 BlockchainReporter
 crypto.news
 Crypto Daily™
 BlockchainReporter
 Optimisus


