Dogecoin (DOGE) Faces Resistance After Strong Weekly Rally
Dogecoin (DOGE)은 강력한 주간 반등 후 저항에 직면
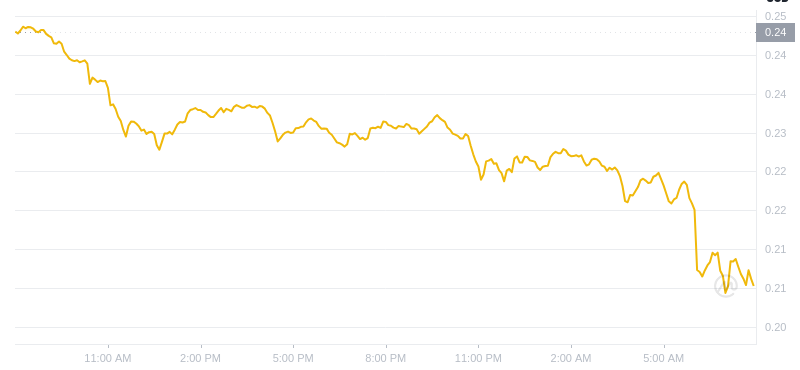
Over the past week, Dogecoin (DOGE) has experienced significant buying pressure, leading to a 27% increase. However, a review of the 1-day chart indicates potential resistance, suggesting a possible short-term reversal in the current rally.
지난 주 동안 Dogecoin(DOGE)은 상당한 매수 압력을 받아 27% 상승했습니다. 그러나 1일 차트를 검토해 보면 잠재적인 저항이 나타나고 있어 현재 랠리가 단기적으로 반전될 가능성이 있음을 시사합니다.
DOGE 1-Day Chart Analysis
DOGE 1일 차트 분석
On the 1-day chart, DOGE's price has reached $0.19216, approximately 2.19% below its daily high of $0.20435. Despite the weekly chart's bullish trend, the daily chart suggests that DOGE may encounter bearish momentum if it continues to retreat from the upper Bollinger band at $0.19082.
1일 차트에서 DOGE의 가격은 일일 최고치인 $0.20435보다 약 2.19% 낮은 $0.19216에 도달했습니다. 주간 차트의 강세 추세에도 불구하고 일일 차트에서는 DOGE가 볼린저 밴드 상단($0.19082)에서 계속 후퇴할 경우 약세 모멘텀에 직면할 수 있음을 시사합니다.
This retreat could indicate a weakening in the bullish trend, as traders may be taking profits at this price level. The Simple Moving Average 20 (SMA) is positioned at $0.15595, providing support to prevent a further decline in DOGE's price should it continue to pull back.
이러한 후퇴는 거래자가 이 가격 수준에서 이익을 얻을 수 있기 때문에 강세 추세가 약화되었음을 나타낼 수 있습니다. 단순 이동 평균 20(SMA)은 $0.15595에 위치하여 DOGE 가격이 계속 하락할 경우 추가 하락을 방지할 수 있는 지원을 제공합니다.
Bollinger Bands Indicate Volatility and Resistance
볼린저 밴드는 변동성과 저항을 나타냅니다.
The Bollinger Bands on the daily chart reveal that DOGE has recently experienced high volatility. Its rise above the upper Bollinger Band at $0.19082 signified increased buying pressure. However, the subsequent pullback from this level suggests DOGE may face challenges in sustaining its rally.
일일 차트의 볼린저 밴드는 DOGE가 최근 높은 변동성을 경험했음을 보여줍니다. $0.19082의 상단 볼린저 밴드 위로 상승한 것은 매수 압력이 증가했음을 의미합니다. 그러나 이 수준의 후속 하락은 DOGE가 랠리를 유지하는 데 어려움을 겪을 수 있음을 시사합니다.
Typically, a price crossing the upper Bollinger Band is followed by a peak in buying pressure in the near term.
일반적으로 가격이 볼린저 밴드 상단을 넘으면 단기적으로 매수 압력이 최고조에 달합니다.
RSI Indicates Overbought Conditions
RSI는 과매수 상태를 나타냅니다.
The Relative Strength Index (RSI) on the daily chart currently stands at 71.83, above the overbought zone of 70. An RSI above 70 typically indicates overbought levels, increasing the likelihood of a short-term price correction as traders secure profits.
일일 차트의 상대 강도 지수(RSI)는 현재 과매수 영역인 70보다 높은 71.83입니다. RSI가 70을 넘으면 일반적으로 과매수 수준을 나타내며 거래자가 수익을 확보함에 따라 단기 가격 조정 가능성이 높아집니다.
If the RSI falls below 70, this would further confirm a reduction in bullish pressure and could indicate a retracement phase. For sustained long-term bullish momentum, the RSI should ideally consolidate around 60-70 levels rather than remaining in the overbought territory.
RSI가 70 아래로 떨어지면 이는 강세 압력의 감소를 더욱 확인하고 되돌림 단계를 나타낼 수 있습니다. 장기적으로 강세 모멘텀을 지속하려면 RSI가 과매수 영역에 머물기보다는 이상적으로 60~70 수준에서 통합되어야 합니다.
Expert Opinions on DOGE
DOGE에 대한 전문가 의견
Dogecoin has garnered considerable attention lately, with market analysts expressing varying perspectives. Analyst Ali predicts that Dogecoin could reach new highs, potentially even exceeding $4-$23, if it breaks through key resistance levels and follows patterns observed in previous bull cycles. Ali attributes the recent price increase to high-profile endorsements.
Dogecoin은 최근 시장 분석가들이 다양한 관점을 표현하면서 상당한 주목을 받고 있습니다. 분석가 Ali는 Dogecoin이 주요 저항 수준을 돌파하고 이전 강세 주기에서 관찰된 패턴을 따른다면 잠재적으로 $4-$23를 초과하는 새로운 최고치에 도달할 수 있다고 예측합니다. 알리는 최근 가격 인상이 세간의 이목을 끄는 지지 덕분이라고 설명합니다.
Conversely, other analysts caution against overinvesting in Dogecoin, highlighting potential risks associated with a price reversal. Given the volatility of the cryptocurrency market, they emphasize that Dogecoin's recent gains could be transient, particularly if there is a surge in profit-taking around current resistance levels.
반대로, 다른 분석가들은 가격 반전과 관련된 잠재적 위험을 강조하면서 Dogecoin에 대한 과잉 투자에 대해 경고합니다. 암호화폐 시장의 변동성을 고려할 때, 그들은 특히 현재 저항 수준을 중심으로 이익실현이 급증하는 경우 Dogecoin의 최근 상승세가 일시적일 수 있음을 강조합니다.


 Optimisus
 DogeHome
 TheNewsCrypto
 Times Tabloid
 DogeHome
 CFN
CFN Crypto Daily™
 DogeHome
 Crypto Daily™


