Dogecoin (DOGE) Faces Resistance After Strong Weekly Rally
ドージコイン(DOGE)、毎週の強い上昇の後、抵抗に直面
Over the past week, Dogecoin (DOGE) has experienced significant buying pressure, leading to a 27% increase. However, a review of the 1-day chart indicates potential resistance, suggesting a possible short-term reversal in the current rally.
過去 1 週間で、ドージコイン (DOGE) は大きな買い圧力を受け、27% の上昇につながりました。しかし、1日チャートを確認すると潜在的な抵抗線があり、現在の上昇相場が短期的に反転する可能性があることが示唆されています。
DOGE 1-Day Chart Analysis
DOGE 1 日チャート分析
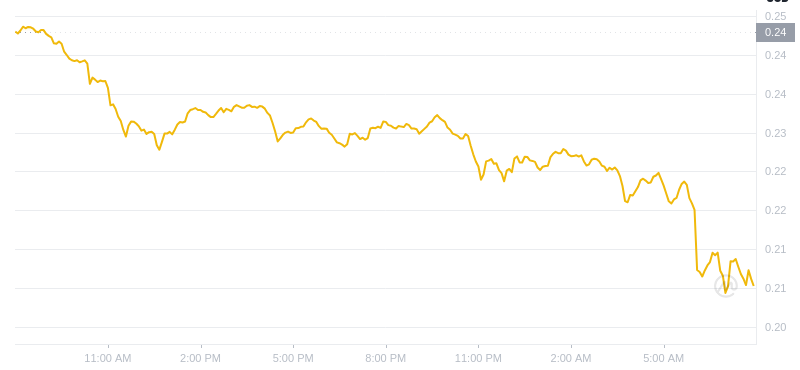
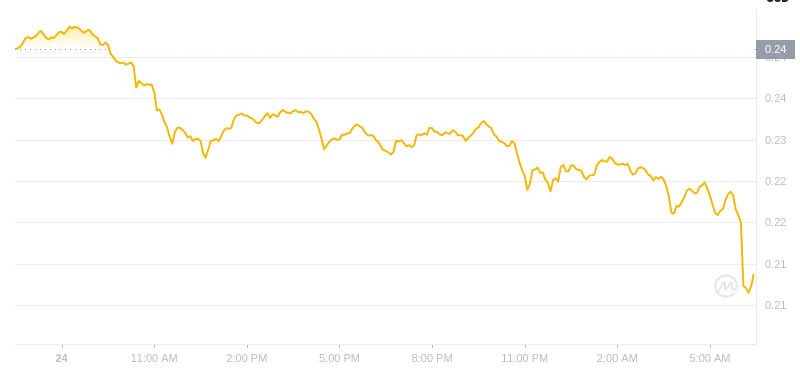
On the 1-day chart, DOGE's price has reached $0.19216, approximately 2.19% below its daily high of $0.20435. Despite the weekly chart's bullish trend, the daily chart suggests that DOGE may encounter bearish momentum if it continues to retreat from the upper Bollinger band at $0.19082.
1日チャートでは、DOGEの価格は0.19216ドルに達し、その日の高値である0.20435ドルを約2.19%下回っています。週足チャートの強気傾向にもかかわらず、日足チャートは、DOGEが0.19082ドルのボリンジャーバンド上部から後退し続ける場合、弱気の勢いに遭遇する可能性があることを示唆しています。
This retreat could indicate a weakening in the bullish trend, as traders may be taking profits at this price level. The Simple Moving Average 20 (SMA) is positioned at $0.15595, providing support to prevent a further decline in DOGE's price should it continue to pull back.
トレーダーがこの価格レベルで利益確定している可能性があるため、この後退は強気トレンドの弱まりを示している可能性があります。単純移動平均 20 (SMA) は 0.15595 ドルに位置しており、DOGE が下落を続けた場合に価格のさらなる下落を防ぐためのサポートとなります。
Bollinger Bands Indicate Volatility and Resistance
ボリンジャーバンドはボラティリティとレジスタンスを示します
The Bollinger Bands on the daily chart reveal that DOGE has recently experienced high volatility. Its rise above the upper Bollinger Band at $0.19082 signified increased buying pressure. However, the subsequent pullback from this level suggests DOGE may face challenges in sustaining its rally.
日次チャートのボリンジャーバンドは、DOGEが最近高いボラティリティを経験していることを明らかにしています。ボリンジャーバンド上部の0.19082ドルを上回る上昇は、買い圧力の高まりを示している。しかし、その後のこの水準からの下落は、DOGEが上昇を維持する上で課題に直面する可能性があることを示唆している。
Typically, a price crossing the upper Bollinger Band is followed by a peak in buying pressure in the near term.
通常、価格がボリンジャーバンドの上部を超えると、短期的には買い圧力のピークが続きます。
RSI Indicates Overbought Conditions
RSIは買われ過ぎの状態を示します
The Relative Strength Index (RSI) on the daily chart currently stands at 71.83, above the overbought zone of 70. An RSI above 70 typically indicates overbought levels, increasing the likelihood of a short-term price correction as traders secure profits.
日足チャートの相対力指数(RSI)は現在71.83で、買われ過ぎゾーンの70を上回っています。RSIが70を超えると通常買われ過ぎのレベルを示し、トレーダーが利益を確保するにつれて短期的な価格調整の可能性が高まります。
If the RSI falls below 70, this would further confirm a reduction in bullish pressure and could indicate a retracement phase. For sustained long-term bullish momentum, the RSI should ideally consolidate around 60-70 levels rather than remaining in the overbought territory.
RSIが70を下回ると、強気圧力の低下がさらに確認され、リトレースメント段階を示す可能性があります。長期的な強気の勢いを持続するには、RSIは買われ過ぎの領域に留まるのではなく、理想的には60〜70レベル付近で固めるべきである。
Expert Opinions on DOGE
DOGE に関する専門家の意見
Dogecoin has garnered considerable attention lately, with market analysts expressing varying perspectives. Analyst Ali predicts that Dogecoin could reach new highs, potentially even exceeding $4-$23, if it breaks through key resistance levels and follows patterns observed in previous bull cycles. Ali attributes the recent price increase to high-profile endorsements.
ドージコインは最近かなりの注目を集めており、市場アナリストはさまざまな見解を表明しています。アナリストのアリ氏は、ドージコインが主要な抵抗線を突破し、過去の強気サイクルで観察されたパターンに従えば、ドージコインが新高値に到達し、4~23ドルを超える可能性さえあると予測している。アリ氏は、最近の価格上昇は注目度の高い支持のおかげだと考えている。
Conversely, other analysts caution against overinvesting in Dogecoin, highlighting potential risks associated with a price reversal. Given the volatility of the cryptocurrency market, they emphasize that Dogecoin's recent gains could be transient, particularly if there is a surge in profit-taking around current resistance levels.
逆に、他のアナリストはドージコインへの過剰投資に警告し、価格反転に伴う潜在的なリスクを強調している。仮想通貨市場のボラティリティを考慮すると、特に現在の抵抗水準付近で利食いが急増した場合、ドージコインの最近の上昇は一時的なものになる可能性があると彼らは強調している。


 Optimisus
 DogeHome
 TheNewsCrypto
 Times Tabloid
 DogeHome
 CFN
CFN Crypto Daily™
 DogeHome
 Crypto Daily™


