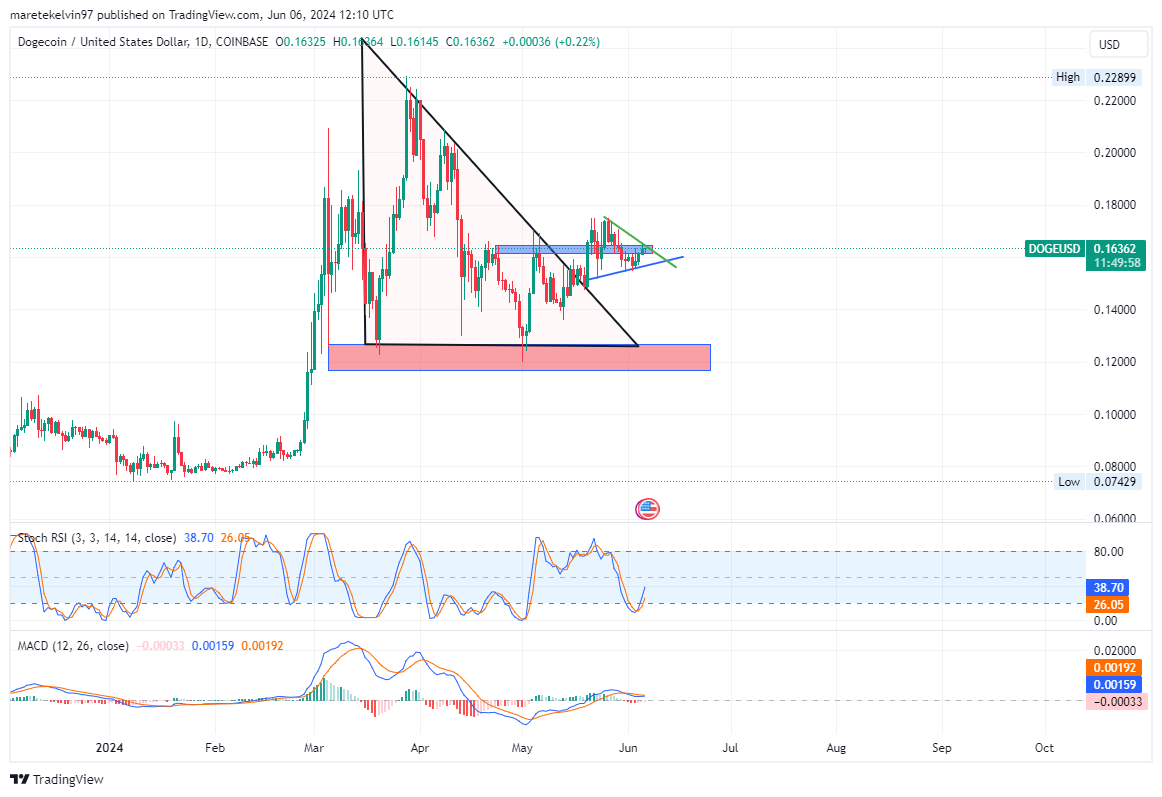
Dogecoin Consolidates in Symmetrical Triangle, Eyes Breakout at $0.163
Dogecoin은 대칭 삼각형으로 통합되어 $0.163에 눈 브레이크 아웃됩니다.
Dogecoin (DOGE) has been trading within a symmetrical triangle for the past three weeks. The price is approaching a breakout point at the $0.163 level. A breakout above this resistance could trigger a surge in price. However, if momentum fails to build, consolidation may continue in the short term.
Dogecoin(DOGE)은 지난 3주 동안 대칭 삼각형 내에서 거래되었습니다. 가격은 $0.163 수준의 돌파점에 접근하고 있습니다. 이 저항선을 넘어서면 가격 급등이 발생할 수 있습니다. 그러나 모멘텀이 구축되지 않으면 단기적으로 통합이 계속될 수 있습니다.
Current Price Action
현재 가격 조치
Dogecoin is currently trading at $0.16 on CoinMarketCap, representing a 0.37% gain in the last 24 hours and a 2.56% increase over the past seven days.
Dogecoin은 현재 CoinMarketCap에서 0.16달러에 거래되고 있으며, 이는 지난 24시간 동안 0.37%, 지난 7일 동안 2.56% 상승한 수치입니다.
Technical Analysis
기술적 분석
- Symmetrical Triangle: Dogecoin is trapped within a symmetrical triangle formation. If the price breaks above $0.163, it could indicate a price spike.
- Stochastic RSI: The indicator is neutral, suggesting neither overbought nor oversold conditions.
- MACD: The lines are close together, indicating potential sideways movement before a trend direction emerges.
Network Activity Insights
대칭 삼각형: Dogecoin은 대칭 삼각형 형태 내에 갇혀 있습니다. 가격이 0.163달러를 넘어서면 가격 급등을 나타낼 수 있습니다. 확률론적 RSI: 지표는 중립적이며 과매수 또는 과매도 상태를 나타내지 않습니다.MACD: 선들이 서로 가까워 추세 방향이 나타나기 전에 잠재적인 횡보 움직임을 나타냅니다.네트워크 활동 통찰력
- Price Volatility: Dogecoin's price volatility has declined, suggesting consolidation.
- Active Addresses: The number has decreased slightly, indicating reduced network activity.
- Whale Transactions: Transactions over $100k USD have remained stable but are showing a downward trend, suggesting minimal activity from large holders.
Market Sentiment
가격 변동성: Dogecoin의 가격 변동성이 감소하여 통합을 시사합니다. 활성 주소: 숫자가 약간 감소하여 네트워크 활동이 감소했음을 나타냅니다. 고래 거래: $100,000 USD 이상의 거래는 안정적으로 유지되었지만 하락 추세를 보이고 있어 대규모 보유자의 활동이 최소화되었음을 시사합니다. .시장심리
The long/short ratio is negative, indicating bearish sentiment in the short run as the price corrects previous gains.
롱/숏 비율은 음수이며, 이는 가격이 이전 상승폭을 조정함에 따라 단기적으로 약세 심리를 나타냅니다.
Conclusion
결론
Technical indicators suggest a consolidation phase, while on-chain data shows stable but reduced activity. Investors should monitor the $0.163 level for potential breakouts. If resistance is overcome, a price increase is likely. However, consolidation may continue in the immediate future.
기술적 지표는 통합 단계를 암시하는 반면, 온체인 데이터는 안정적이지만 감소된 활동을 보여줍니다. 투자자들은 잠재적인 돌파가 있는지 $0.163 수준을 모니터링해야 합니다. 저항이 극복되면 가격이 상승할 가능성이 높습니다. 그러나 통합은 가까운 시일 내에 계속될 수 있습니다.
[Source: Tradingview]
[출처: 트레이딩뷰]
Additional Notes
추가 참고 사항
 represent placeholders for external sources.
- Suspected advertising content and unnecessary promotional elements have been removed.
외부 소스에 대한 자리 표시자를 나타냅니다. 의심되는 광고 콘텐츠와 불필요한 홍보 요소가 제거되었습니다.


 TheNewsCrypto
 TheNewsCrypto
 DogeHome
 Crypto Daily™
 Crypto Daily™
 Crypto Daily™
 Optimisus
 CoinsProbe
 CryptoNewsLand


