Dogecoin Consolidates in Symmetrical Triangle, Eyes Breakout at $0.163
ドージコインは対称三角形で統合、0.163ドルでアイズブレイクアウト
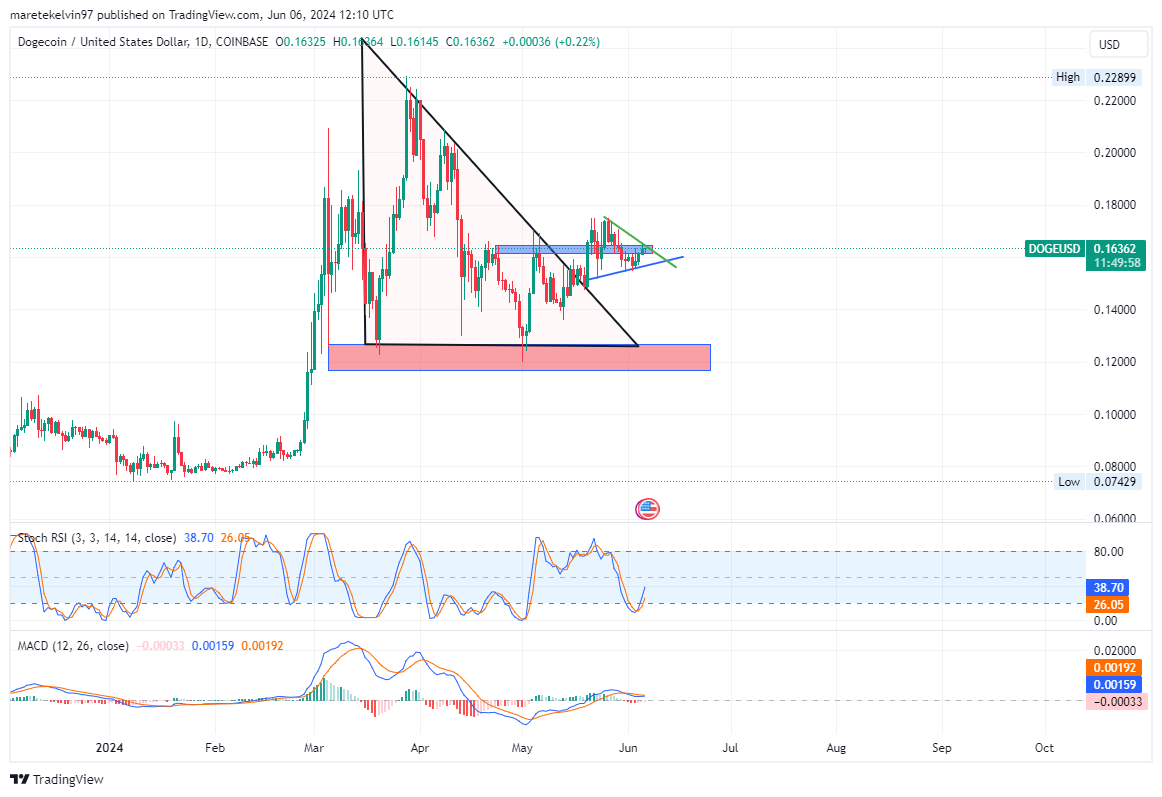
Dogecoin (DOGE) has been trading within a symmetrical triangle for the past three weeks. The price is approaching a breakout point at the $0.163 level. A breakout above this resistance could trigger a surge in price. However, if momentum fails to build, consolidation may continue in the short term.
ドージコイン(DOGE)は過去3週間、対称的な三角形内で取引されてきました。価格は0.163ドルレベルのブレイクアウトポイントに近づいています。このレジスタンスを上抜けた場合、価格の急騰を引き起こす可能性があります。しかし、勢いが構築できなければ、短期的には統合が続く可能性がある。
Current Price Action
現在の価格アクション
Dogecoin is currently trading at $0.16 on CoinMarketCap, representing a 0.37% gain in the last 24 hours and a 2.56% increase over the past seven days.
ドージコインは現在、CoinMarketCap で 0.16 ドルで取引されており、過去 24 時間で 0.37% 上昇し、過去 7 日間で 2.56% 上昇しました。
Technical Analysis
テクニカル分析
- Symmetrical Triangle: Dogecoin is trapped within a symmetrical triangle formation. If the price breaks above $0.163, it could indicate a price spike.
- Stochastic RSI: The indicator is neutral, suggesting neither overbought nor oversold conditions.
- MACD: The lines are close together, indicating potential sideways movement before a trend direction emerges.
Network Activity Insights
対称三角形: Dogecoin は対称三角形の構造内に閉じ込められています。価格が 0.163 ドルを超えた場合、価格の急騰を示している可能性があります。確率的 RSI: 指標は中立であり、買われすぎでも売られすぎでもない状態を示唆しています。MACD: 線が互いに接近しており、トレンドの方向が現れる前に横方向に動く可能性があることを示しています。ネットワーク アクティビティ インサイト
- Price Volatility: Dogecoin's price volatility has declined, suggesting consolidation.
- Active Addresses: The number has decreased slightly, indicating reduced network activity.
- Whale Transactions: Transactions over $100k USD have remained stable but are showing a downward trend, suggesting minimal activity from large holders.
Market Sentiment
価格変動性: ドージコインの価格変動性が低下し、統合を示唆しています。アクティブなアドレス: 数がわずかに減少し、ネットワーク活動の低下を示しています。クジラ取引: 100,000 米ドルを超える取引は安定していますが、下降傾向を示しており、大口保有者による活動が最小限であることを示唆しています。 .市場センチメント
The long/short ratio is negative, indicating bearish sentiment in the short run as the price corrects previous gains.
ロング/ショート比率はマイナスであり、価格が以前の上昇を修正するにつれて短期的には弱気のセンチメントを示しています。
Conclusion
結論
Technical indicators suggest a consolidation phase, while on-chain data shows stable but reduced activity. Investors should monitor the $0.163 level for potential breakouts. If resistance is overcome, a price increase is likely. However, consolidation may continue in the immediate future.
テクニカル指標は統合段階を示唆していますが、オンチェーンデータは安定しているものの活動が低下していることを示しています。投資家は0.163ドルのレベルをブレイクアウトする可能性があるか監視する必要がある。抵抗が克服されれば、価格が上昇する可能性があります。ただし、統合は当面続く可能性があります。
[Source: Tradingview]
[出典:トレーディングビュー]
Additional Notes
その他の注意事項
 represent placeholders for external sources.
- Suspected advertising content and unnecessary promotional elements have been removed.
外部ソースのプレースホルダーを表します。疑わしい広告コンテンツと不要な宣伝要素は削除されました。


 TheNewsCrypto
 TheNewsCrypto
 DogeHome
 Crypto Daily™
 Crypto Daily™
 Crypto Daily™
 Optimisus
 CoinsProbe
 CryptoNewsLand


