

Dogecoin's price is holding a key support level, mirroring its performance during the 2017 and 2021 market cycles.
Dogecoin의 가격은 주요 지원 수준을 유지하여 2017 년 및 2021 년 시장주기 동안 성능을 반영하고 있습니다.
Analysts predict a minimum price target of $26 based on these historical trends. The market awaits confirmation of a bottom before the next upward phase begins.
분석가들은 이러한 역사적 추세에 따라 최소 가격 목표 $ 26을 예측합니다. 시장은 다음 상향 단계가 시작되기 전에 바닥의 확인을 기다리고 있습니다.
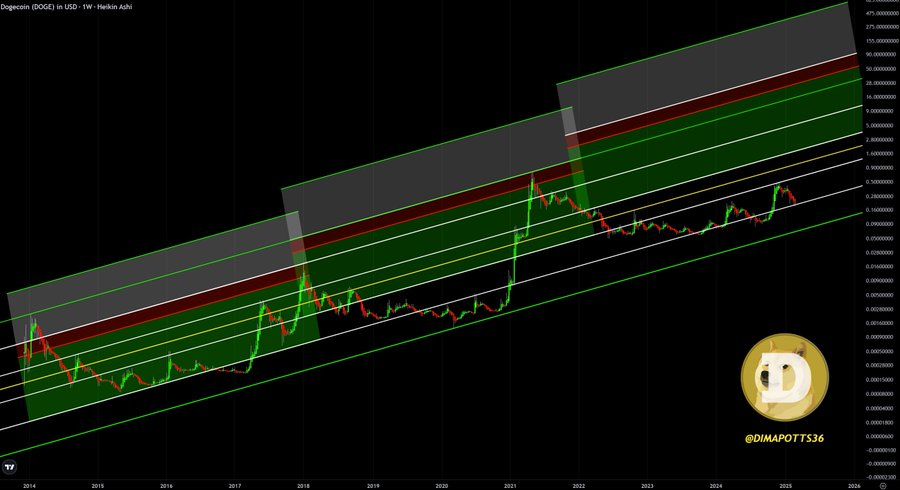
Dogecoin's weekly chart shows a striking resemblance to its previous cycles in 2017 and 2021. The current price remains within a well-defined range, with the weekly candle holding steady at a critical support level. This structural similarity to past trends suggests a potential upward movement once a confirmed bottom is established.
Dogecoin의 주간 차트는 2017 년과 2021 년의 이전주기와 눈에 띄는 유사점을 보여줍니다. 현재 가격은 잘 정의 된 범위 내에 남아 있으며 주간 촛불은 중요한 지원 수준에서 꾸준히 유지됩니다. 과거의 추세와의 이러한 구조적 유사성은 확인 된 바닥이 확립되면 잠재적 상향 운동을 시사합니다.
Dogecoin's Market Structure Echoes Past Cycles
Dogecoin의 시장 구조는주기를지나갑니다
Observations from Doge Capital on X highlight the alignment of Dogecoin's current price action with its previous cycles. In both the 2017 and 2021 bull runs, Dogecoin exhibited a similar pattern before breaking through to higher resistance levels. The parallel lines on the weekly chart underscore the continuation of this historical trend, which previously preceded significant price increases.
X의 Doge Capital의 관찰은 Dogecoin의 현재 가격 행동과 이전주기와의 조정을 강조합니다. 2017 년과 2021 년 Bull Runs에서 Dogecoin은 유사한 패턴을 보여주기 전에 더 높은 저항 수준으로 나누었습니다. 주간 차트의 평행선은 이전에 상당한 가격 인상보다 이전 에이 역사적 추세의 지속을 강조합니다.
Source: DOGE CAPITAL (X)
출처 : Doge Capital (X)
The next phase of the cycle is anticipated following confirmation of a bottom. Based on past performance, Dogecoin could then move towards a key resistance level situated just above the identified parallel line. A continuation of this pattern could trigger a significant price surge.
사이클의 다음 단계는 바닥의 확인 후 예상됩니다. 과거의 성능에 따라 Dogecoin은 식별 된 평행선 바로 위에 위치한 키 저항 수준으로 이동할 수 있습니다. 이 패턴의 연속은 상당한 가격 급등을 유발할 수 있습니다.
Minimum Target of $26 Based on Historical Data
역사적 데이터를 기반으로 최소 $ 26의 목표
The final phase of Dogecoin's previous market cycles resulted in substantial price appreciation. Analysts have identified a parallel red zone on the chart that historically marked Dogecoin's peak price. This zone has consistently influenced price movements before the start of new cycles.
Dogecoin의 이전 시장주기의 마지막 단계는 상당한 가격 인식을 초래했습니다. 분석가들은 역사적으로 Dogecoin의 최고 가격을 표시 한 차트에서 평행 레드 존을 확인했습니다. 이 영역은 새로운 사이클이 시작되기 전에 가격 변동에 지속적으로 영향을 미쳤습니다.
Currently, the lower boundary of this red zone sits at $26. This level gradually increases due to the chart's slope, establishing it as the minimum target for this cycle. Historical data indicates a structured price path for Dogecoin, suggesting a potential repetition of this pattern.
현재이 레드 존의 하한은 26 달러입니다. 이 레벨은 차트의 기울기로 인해 점차 증가 하여이 사이클의 최소 대상으로 설정합니다. 과거 데이터는 Dogecoin의 구조적 가격 경로를 나타내며,이 패턴의 잠재적 반복을 시사합니다.
Dogecoin's price action remains closely tied to its historical cycles. The market is currently focused on confirmation of a bottom before the next upward phase commences. If the established pattern holds, Dogecoin could experience a strong upward price movement.
Dogecoin의 가격 행동은 역사적주기와 밀접한 관련이 있습니다. 시장은 현재 다음 위상이 시작되기 전에 바닥의 확인에 중점을 둡니다. 확립 된 패턴이 유지되면 Dogecoin은 강력한 상승 가격 이동을 경험할 수 있습니다.
 Crypto News Land
 DogeHome
 CoinsProbe
 Optimisus
 Crypto News Land
 The Coin Republic
 BlockchainReporter


