

Dogecoin's price is holding a key support level, mirroring its performance during the 2017 and 2021 market cycles.
DogeCoinの価格は、2017年と2021年の市場サイクル中のパフォーマンスを反映して、主要なサポートレベルを保持しています。
Analysts predict a minimum price target of $26 based on these historical trends. The market awaits confirmation of a bottom before the next upward phase begins.
アナリストは、これらの歴史的傾向に基づいて、26ドルの最低価格目標を予測しています。 市場は、次の上向きフェーズが始まる前に底の確認を待っています。
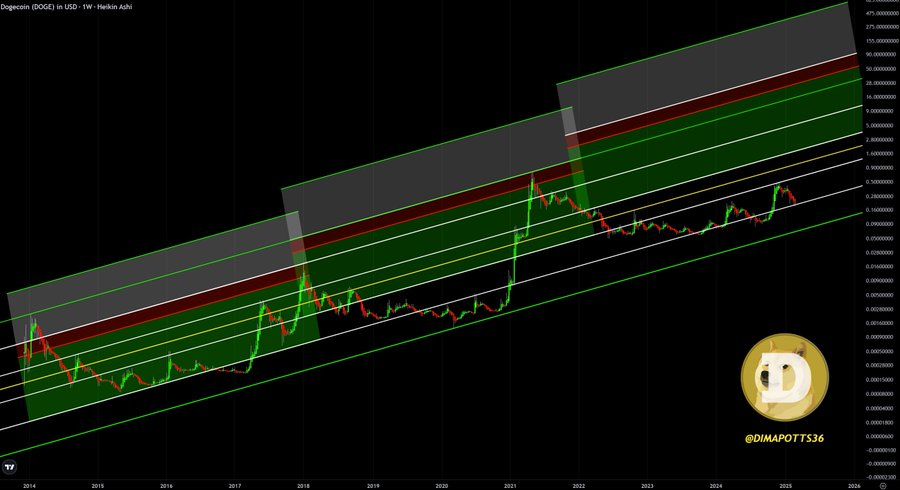
Dogecoin's weekly chart shows a striking resemblance to its previous cycles in 2017 and 2021. The current price remains within a well-defined range, with the weekly candle holding steady at a critical support level. This structural similarity to past trends suggests a potential upward movement once a confirmed bottom is established.
Dogecoinの毎週のチャートは、2017年と2021年の以前のサイクルに驚くほど似ていることを示しています。現在の価格は明確に定義された範囲内にあり、毎週のろうそくが重要なサポートレベルで安定しています。 過去の傾向とのこの構造的な類似性は、確認された底が確立された後の潜在的な上向きの動きを示唆しています。
Dogecoin's Market Structure Echoes Past Cycles
Dogecoinの市場構造は、過去のサイクルを反映しています
Observations from Doge Capital on X highlight the alignment of Dogecoin's current price action with its previous cycles. In both the 2017 and 2021 bull runs, Dogecoin exhibited a similar pattern before breaking through to higher resistance levels. The parallel lines on the weekly chart underscore the continuation of this historical trend, which previously preceded significant price increases.
XのDoge Capitalからの観察は、Dogecoinの現在の価格アクションの前のサイクルとの整合性を強調しています。 2017年と2021年のブルランの両方で、Dogecoinは同様のパターンを示した後、より高い抵抗レベルに突入しました。 毎週のチャートの平行線は、以前は大幅な価格上昇に先行するこの歴史的傾向の継続を強調しています。
Source: DOGE CAPITAL (X)
出典:Doge Capital(x)
The next phase of the cycle is anticipated following confirmation of a bottom. Based on past performance, Dogecoin could then move towards a key resistance level situated just above the identified parallel line. A continuation of this pattern could trigger a significant price surge.
サイクルの次の段階は、底部の確認後に予想されます。過去のパフォーマンスに基づいて、Dogecoinは、特定された並列線のすぐ上にある重要な抵抗レベルに向かって移動できます。 このパターンの継続は、かなりの価格の急増を引き起こす可能性があります。
Minimum Target of $26 Based on Historical Data
履歴データに基づいて、最低26ドルの目標
The final phase of Dogecoin's previous market cycles resulted in substantial price appreciation. Analysts have identified a parallel red zone on the chart that historically marked Dogecoin's peak price. This zone has consistently influenced price movements before the start of new cycles.
Dogecoinの以前の市場サイクルの最終段階は、実質的な価格上昇をもたらしました。アナリストは、歴史的にDogecoinのピーク価格をマークしたチャートの並列レッドゾーンを特定しました。このゾーンは、新しいサイクルの開始前に一貫して価格の動きに影響を与えてきました。
Currently, the lower boundary of this red zone sits at $26. This level gradually increases due to the chart's slope, establishing it as the minimum target for this cycle. Historical data indicates a structured price path for Dogecoin, suggesting a potential repetition of this pattern.
現在、このレッドゾーンの下限は26ドルです。 このレベルは、チャートの勾配により徐々に増加し、このサイクルの最小ターゲットとして確立します。履歴データは、Dogecoinの構造化された価格経路を示しており、このパターンの潜在的な繰り返しを示唆しています。
Dogecoin's price action remains closely tied to its historical cycles. The market is currently focused on confirmation of a bottom before the next upward phase commences. If the established pattern holds, Dogecoin could experience a strong upward price movement.
Dogecoinの価格アクションは、その歴史的なサイクルと密接に結びついています。 市場は現在、次の上向きのフェーズが始まる前の底部の確認に焦点を当てています。 確立されたパターンが当てはまる場合、Dogecoinは強力な上昇価格の動きを経験する可能性があります。
 CoinoMedia
 Crypto News Land
 DogeHome
 CoinsProbe
 Optimisus
 Crypto News Land
 The Coin Republic


